
First lien mortgage originations reached their highest level in the second quarter of 2016 of any single quarter since the same period in 2013. Black Knight Financial Services, in its latest Mortgage Monitor, said the strong numbers were due to both a growth in home purchases and a new wave of interest rate-driven refinancing,
Originations in the second quarter totaled $518 billion with purchase mortgage originations accounting for $297 billion of the total, a 57 percent share. This was a gain of 52 percent or $102 billion from Quarter 1 and was the highest level in both volume and dollar amount since 2007.
Refinancing volume for the quarter was $221 billion. While an increase of 8 percent from the previous quarter the volume was down slightly from a year earlier.
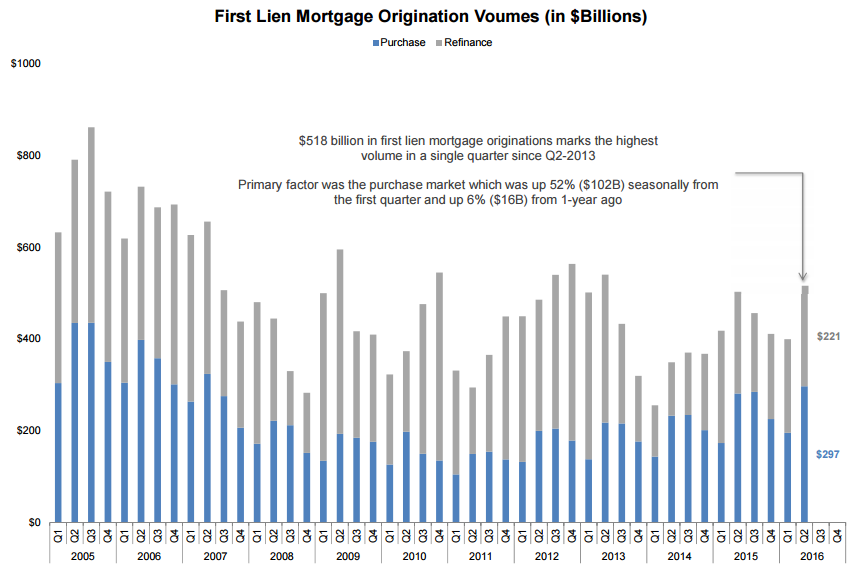
Black Knight Executive Vice President Ben Graboske said the decline from a year earlier came despite the number of potential refinance candidates outpacing 2015 by over one million in every month since March. "That said, refinance lending has risen for three consecutive quarters and accounted for $221 billion in originations in Q2. Interestingly however, with interest rates 15 basis points lower than in Q1, and even lower than in early 2015, refinance activity wasn't nearly as strong as one might have expected. "
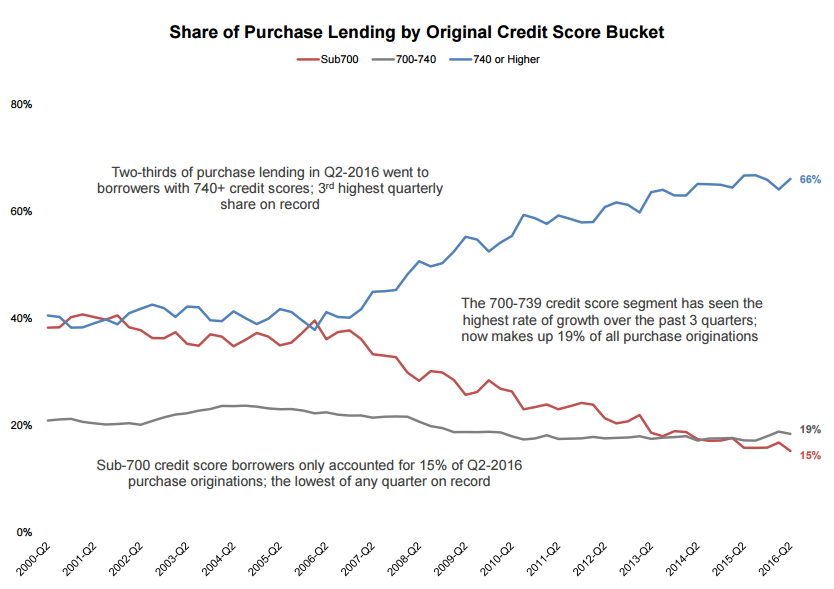
Graboske said that even though "the purchase lending credit box remains tight," and two thirds of the purchase loans went to borrowers with credit score of 740 or higher, there is increasing participation among those with moderate credit as well. While the numbers of high credit originations were about on a par with the same period in 2015, there was a 13 percent year-over-year increase in lending to borrowers with credit scores between 700 and 739. This was highest rate of growth of any credit bucket over the last three quarters and twice the annual growth rate of the overall purchase market - and those loans now make up 19 percent of all purchase originations
"On the other end of the spectrum," Graboske added, "sub-700 score borrowers now account for only 15 percent of originations, with less than five percent going to borrowers with scores of 660 or below. Both of these mark the lowest share of low credit purchase lending seen dating back to at least 2000."
The same increase among moderate score borrowers was not evident on the refinance side where the share of lower credit score (under 740) borrowers has been relatively flat, accounting for only a slightly higher portion of originations than in the second quarter of 2015. Most of the decline and fluctuation has taken place in higher credit segments of the market. There has also been an increase in the prepays among loans that remain in private label securities (PLS). This indicates, the Monitor said, that some of those borrowers who had been struggling with equity issues "are finding their way into the daylight." GNMA loans continue to outpace other investor segments in this regard, probably indicating that increases in equity and new steamline products have made it easier for FHA borrowers to refinance out of mortgage insurance requirements.
The Monitor also took a look at the performance of second lien home equity lines of credit (HELOCs), especially those that are facing end of draw resets. It found that the delinquency rate of these loans continues to rise on an annual basis. June was the fourth consecutive month for such increases where previously there had been only one such annual deterioration in nearly four years.
The HELOC delinquency rate in June was 8 percent higher than in June 2015 while, as context, first lien delinquencies were down 10 percent over the same period. The increase is being driven almost entirely by those loans that have reset, currently those originated during the "bubble era" of 2004 to 2006. There is an 83 basis point separation in delinquency rates between loans originated in that bubble period and more recent vintages whereas there was only a 43 basis point differential in early 2014, as the first of these vintages began to reset. Black Knight says this clearly shows the upward pull that the resets have on overall HELOC delinquencies.
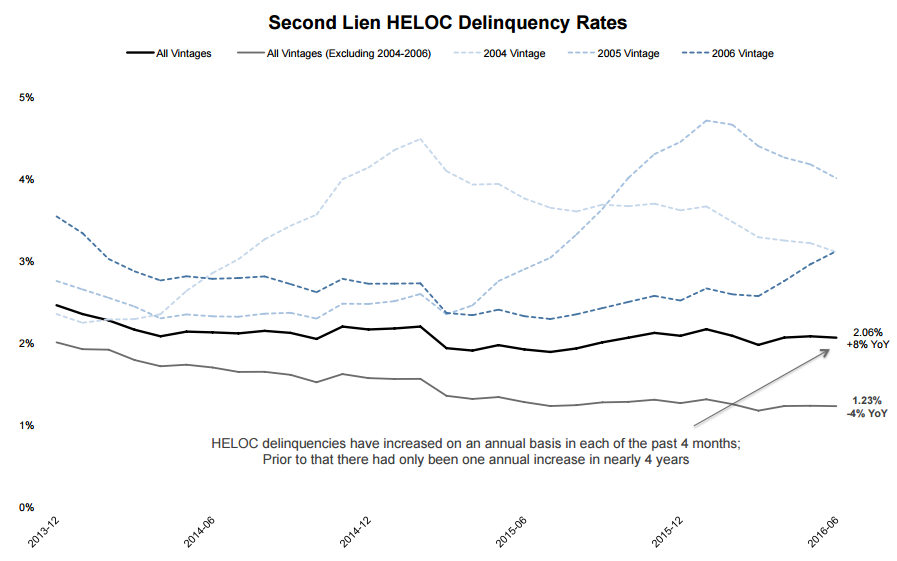
Loans originated in 2006 began to reset at the beginning of this year and that vintages delinquency rate rose 24 percent from January to June. This was a more pronounced initial deterioration than had been noted in the 2004 and 2005 crop of loans during their first reset years. There was however a five percent increase (to 50 percent) in the share of the 2006 vintage which reset early in the year resets. This, the Monitor says, may have front-loaded any reset-generated spike. If so, we may see a more normal activity during the back half of this year.
Other contributing factors may be less benign. One could be that the payment shock, an average increase post-reset of $250 per month, is the highest for any vintage historically. Another is that equity levels remain an issue with 18 percent of the 2006 vintage remaining underwater and an additional 12 percent with less than 10 percent equity. While these percentages are lower than a year ago, it still means that refinancing out of the payment shocks is problematic.
Over one-third of borrowers facing resets pay off or close their HELOC lines within the time frame of 12 months prior to reset to 3 months after, and significant prepayment activity has been linked to resets. This is especially the case among borrowers with high credit scores and/or low loan-to-value (LTV) ratios and those in the both the low and high ends of either payment shocks or their unpaid principal balances. As these groups are the lower risk segments of borrowers, this may also contribute to the rise in delinquency rates among the higher risk populations that remain as borrowers.
Finally, Black Knight looked at recent trends in distressed sale activity (REO and short sales), and found that such sales accounted for 7 percent of all residential transactions in Q2 2016, the lowest share in nine years, but still more than twice the 'normal' market level of just over three percent. At the peak (Q2 2011), there were over 350,000 distressed sales in a single quarter, and distressed sales had accounted for nearly 40 percent of all transactions in Q1 2011; there are now less than 100,000 distressed sales per quarter
Short sales account for only about a third of distressed sales, the remainder are from REO inventories. This has been the proportion for the last several years while at the peak short sales accounted for 50 percent of distressed sales.
The discount buyers were achieving from short sales has been declining nationally and is now averaging 21 percent. At the same time the average REO discount is higher than a year ago at 27 percent.
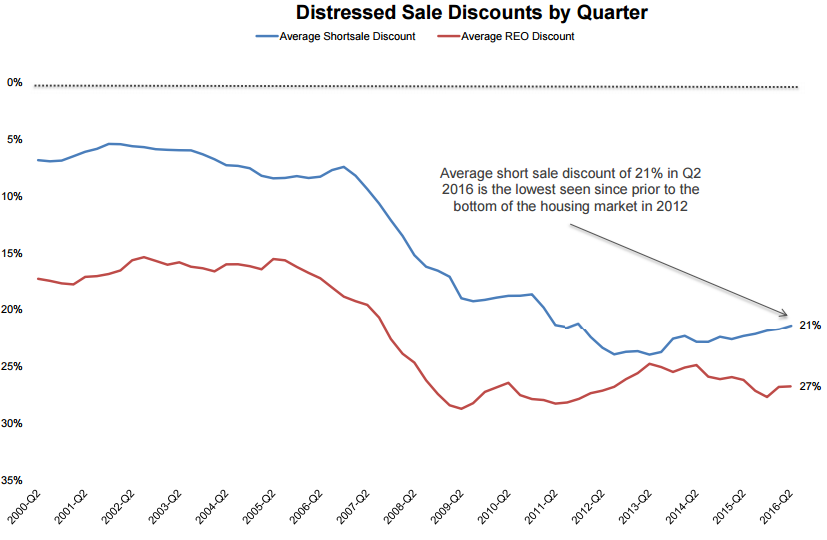
The decline in short sale discounts and volume may indicate servicers are less willing to deeply discount properties because of decline backlogs or optimism about alternative loss mitigation methods. The rise in REO discounts are attributed by the Monitor to a geographic shift in sales from areas such as Florida with low discounts (the average in that state is 23 percent) to the Northeast and the Rust Belt. Florida still accounts for 20 percent of destressed sales nationwide but that is waning. Ohio has the largest discounts at 44 percent while both New Hampshire and New York average 41 percent. The smallest REO discounts were found in the Southwest, with Texas (14 percent) and Nevada (16 percent) seeing the lowest of all.
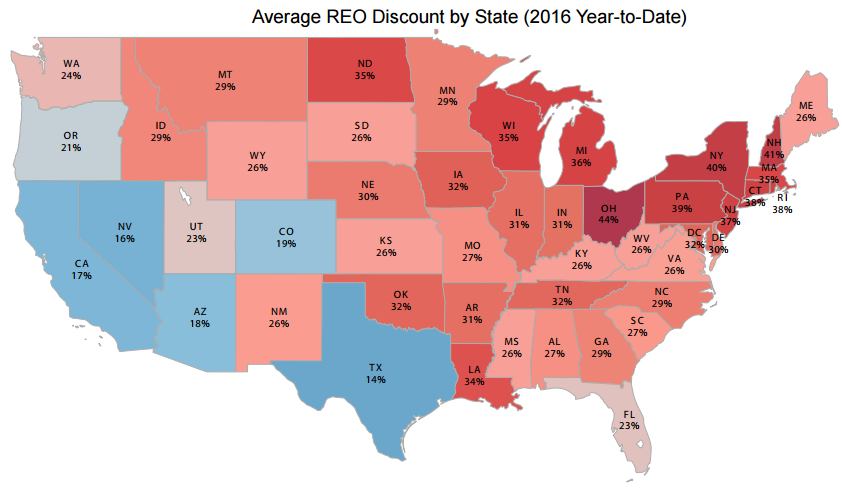
The March 2016 Mortgage Monitor looked at normalization of troubled mortgage inventories and predicted the Northeast among the last to normalize; this overall delayed recovery is likely playing a part in the higher levels of REO discounts


