
Both S&P/Case-Shiller and Black Knight Financial Services report that home prices continued to rise in April. Their numbers, while covering different universes and utilizing different methodology, came in at fairly similar levels.
The Case-Shiller National Home Price Index rose 5.0 percent on an annual basis in April, a slightly slower rate of appreciation than in March when the gain was 5.1 percent. The 10-City Composite Index posted a 4.7 percent annual increase, and the 20-City rose 5.4 percent. Both city indices echoed the National Index, with their gains slowing by 0.1 percentage point from March.
Nine of the 20 cities reported greater price increases for the year ended in April than they had for the year ended in March. Once again the highest rates of year-over-year price gains were reported in Portland at 12.3 percent, Seattle at 10.7 percent, and Denver with a 9.5 percent increase.
On a month-over-month basis the National Index, which covers all nine U.S. census divisions, rose 1.0 percent before seasonal adjustment and 0.1 percent after. The 10-City was up 1.0 unadjusted and 0.3 percent adjusted and the 20-City reported 1.1 percent appreciation and 0.5 percent respectively. After seasonal adjustment, 15 cities saw prices rise, two cities were unchanged, and three cities experienced negative monthly prices changes.
"The housing sector continues to turn in a strong price performance with the S&P/Case-Shiller National Index rising at a 5% or greater annual rate for six consecutive months," says David M. Blitzer, Managing Director and Chairman of the Index Committee at S&P Dow Jones Indices. "The home price increases reflect the low unemployment rate, low mortgage interest rates, and consumers' generally positive outlook. One result is that an increasing number of cities have surpassed the high prices seen before the Great Recession. Currently, seven cities - Denver, Dallas, Portland OR, San Francisco, Seattle, Charlotte, and Boston - are setting new highs.
"However, the outlook is not without a lot of uncertainty and some risk. Last week's vote by Great Britain to leave the European Union is the most recent political concern while the U.S. elections in the fall raise uncertainty and will distract home buyers and investors in the coming months. The details in the S&P/Case-Shiller Home Price data also hint at possible softness. Seasonally adjusted figures in the report show that three cities saw lower prices in April compared to only one city in March. Among the 20 cities, 16 saw either declines or smaller increases in monthly prices in the seasonally adjusted numbers."
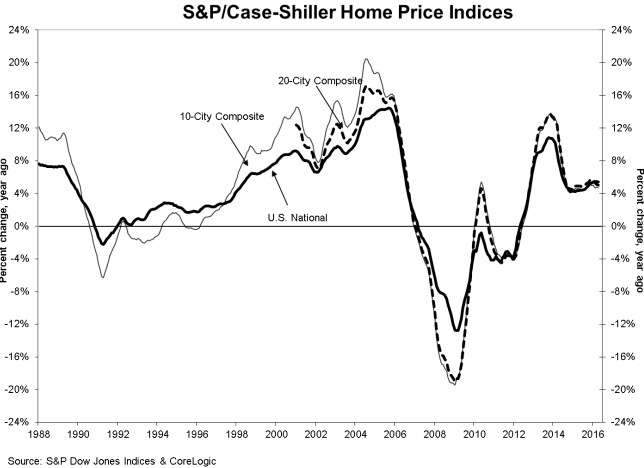
As of April 2016, average home prices for the MSAs within the 10-City and 20-City Composites are back to their winter 2007 levels. Measured from their June/July 2006 peaks, the peak-to-current decline for both Composites is approximately 10.7-12.7%. Since the March 2012 lows, the 10-City and 20-City Composites have recovered 37.7% and 39.2%.
Black Knight showed similar if slightly higher increases for its Home Price Index (HPI). The national index rose 5.4 percent year-over year to $260,000 and was up 1.0 percent from March.
Washington had the greatest increase among states, gaining 1.9 percent from March, the third consecutive month that state has led the nation. Two of its largest cities, Seattle and Walla Walla, had monthly gains of 2.0 percent. Cheyenne, Wyoming also saw prices rise by 2.0 percent followed by Portland, Oregon; Mount Vernon, Washington; and Cumberland, Maryland all at 1.8 percent. Other states with large monthly increases were Oregon with at 1.7 percent and Utah, Idaho, and Georgia all at 1.5 percent
Prices peaked on the Black Knight index in June 2006 at $267,000 so the current index value is only 2.9 percent from that level. It has recovered by 30.4 percent from the market bottom in of $199,000 in 2012 and has risen 3.0 percent from the first of the year.
All states and metro areas saw price increases in April. Five of the largest states and 14 of the 40 largest metros hit new price peaks.
The Black Knight HPI utilizes repeat sales data from its national public records data set, as well as its loan-level mortgage performance data, to capture home price data from both disclosure and non-disclosure states.
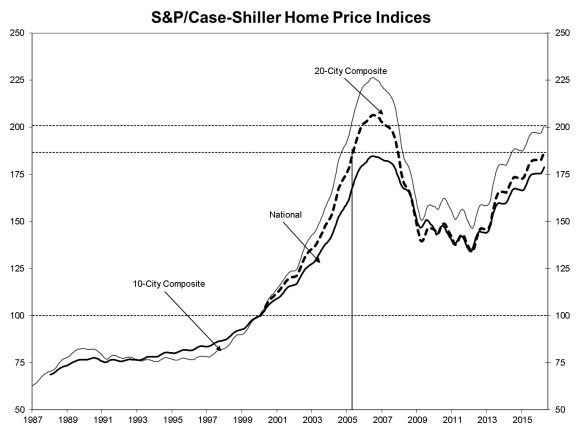
The S&P/Case-Shiller Home Price Indices are constructed to accurately track the price path of typical single-family home pairs for thousands of individual houses from the available universe of arms-length sales data. The S&P/Case-Shiller National U.S. Home Price Index tracks the value of single-family housing within the United States. The indices have a base value of 100 in January 2000; thus, for example, a current index value of 150 translates to a 50 percent appreciation rate since January 2000 for a typical home located within the subject market.
The 10-City Composite currently has an index level of 200.78 and the 20-City a value of 186.63. The National Index is at 178.69. Detroit continues to have the lowest index value at 105.15 and Los Angeles the highest at 246.18.


