Negative equity levels in the U.S. have dropped to rates last seen since 2006. However Black Knight Financial Services points out that, while improvement continues on a national basis, the recovery from previous high rates of negative equity "is decidedly imbalanced in terms of both home price levels and geography."
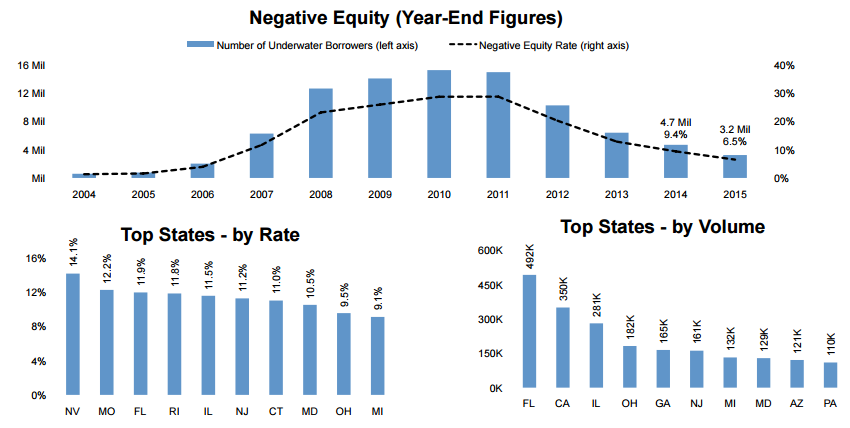
In the current edition of its Mortgage Monitor Black Knight said that, based on February data, 6.5 percent of all homeowners with a mortgage remain underwater, that is owning more on their mortgage than the market value of their home. This equates to 3.2 million borrowers and represents $126 billion in negative first and second mortgage debt. While the number of underwater borrowers declined by 31 percent over the course of 2015, over half of underwater homes are in the bottom 20 percent of homes by price in their respective markets. Among that lowest home price tier the negative equity position is nearly 10 percentage points higher than the national number (16.2 percent) and improving at a slower pace that all other tiers.
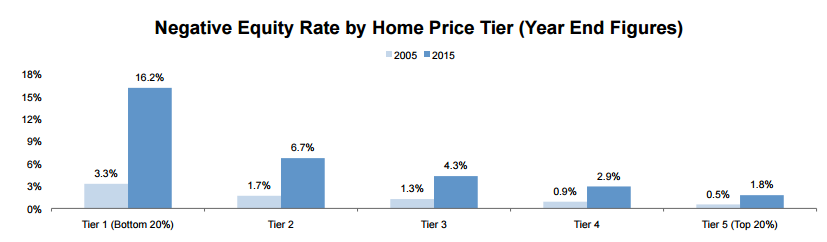
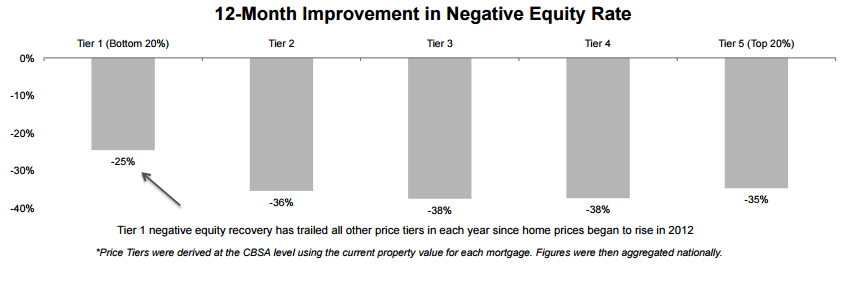
The Monitor says that while there has always been a disparity between the top and bottom 20 percent price tiers with regard to negative equity, this has been exaggerated even further by the dramatic rise and fall of housing prices on the low end during the bubble and bust years. This is not to say that negative equity is not improving among lower priced properties, it has decreased by 25 percent over the last 12 months, but it has lagged all other price tiers since home prices began to rise in 2012.
Black Knight Data & Analytics Senior Vice President Ben Graboske said, "Throughout 2015, the negative equity population in the U.S. decreased by over 30 percent, bringing another 1.5 million homeowners out from underwater on their mortgages. However, even after four years of improvement, the recovery has not reached all corners." He said that the more than half of underwater properties in the lowest 20 percent of local markets is the highest share on record. "Furthermore, this group is seeing a slower recovery than the nation as a whole," he said.
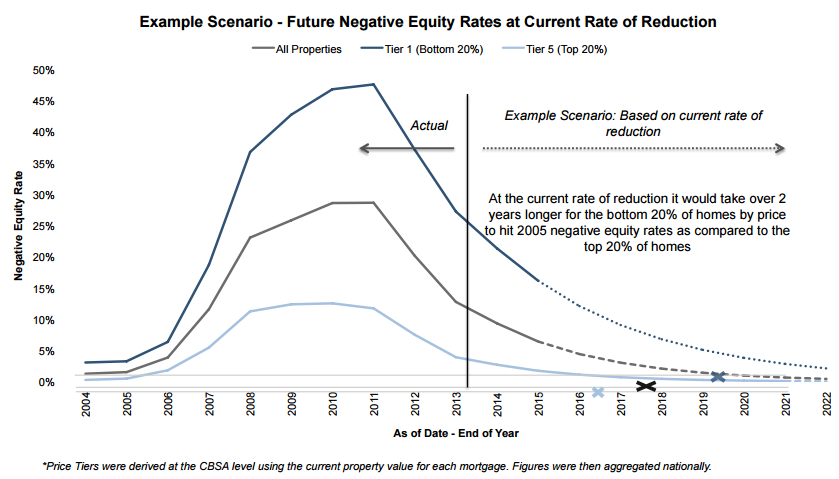
Using the 2015 calendar year reduction in negative equity rates for each price tier, an overall decline of 31 percent 25 percent for Tier 1, the lowest tier, and 35 percent for Tier 5, the highest priced homes, Black Knight's analysts projected into the future. The company said those rates are relatively consistent with what they have seen since the housing recovery began in 2012.
At the end of 2011, over 45 percent of all Tier 1 properties were underwater. At the current rate of improvement, it would take approximately four more years for the overall negative equity rate to reach the levels of 2005 and nearly two additional years for those homes in the bottom 20 percent to do so.
There is also variation in negative equity recovery by geographic area. In Nevada, where the Black Knight Home Price Index shows home prices still 34 percent below their peak, over 14 percent of borrowers are still underwater on their mortgages, the largest share in the nation. The largest number of borrowers in negative equity, just under a half million, are in Florida. Missouri was the only state to see its underwater population actually rise in 2015, due to falling home prices in the state.
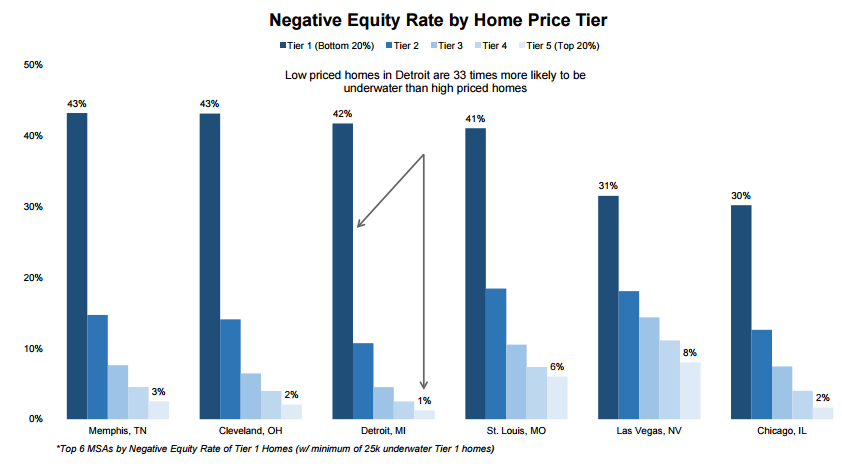
The discrepancy by price tier was even more notable in some metropolitan areas. Detroit has the most extreme variation between high- and low-end housing with lower prices homes 33 times more likely to be underwater than the high-priced ones. This can be pretty easily explained as lower tier homes in Detroit are still off of their 2006 price peaks by 35 percent while higher priced ones are within 7 percent of 2006 levels.
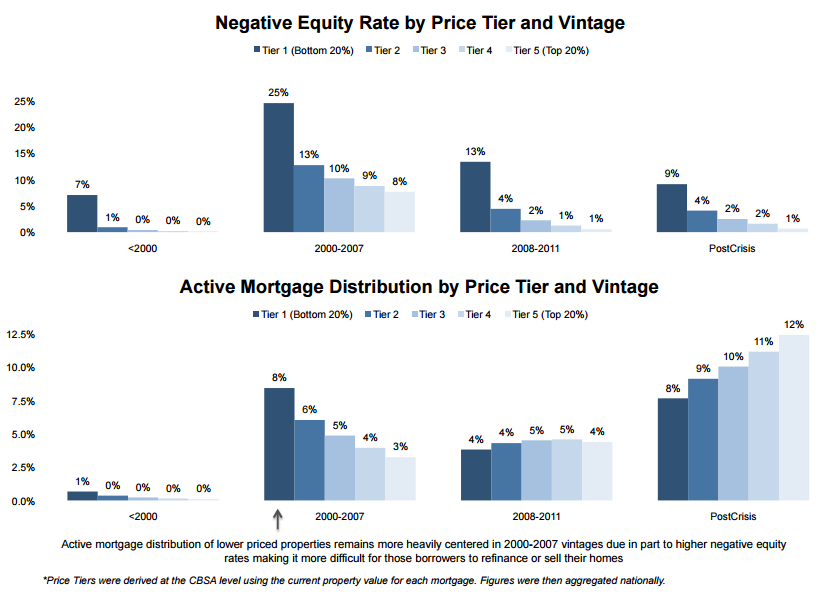
Finally, Black Knight looked at negative equity by loan vintage and found the over 60 percent of all underwater properties were originated between 2000 and 2007 and over half were in the 2005-2007 vintages. The Home Affordable Refinance Program was designed to limit this situation however those loans are only available to borrowers with GSE backed mortgages and who are current on those loans. The data also shows that lingering negative equity has also impacted the make-up of active loan populations.
As can be seen, lingering negative equity rates have resulted in a higher concentration of Tier 1 properties in pre-crisis vintages while a higher concentration of Tier 5 properties is found in post-crisis vintages.
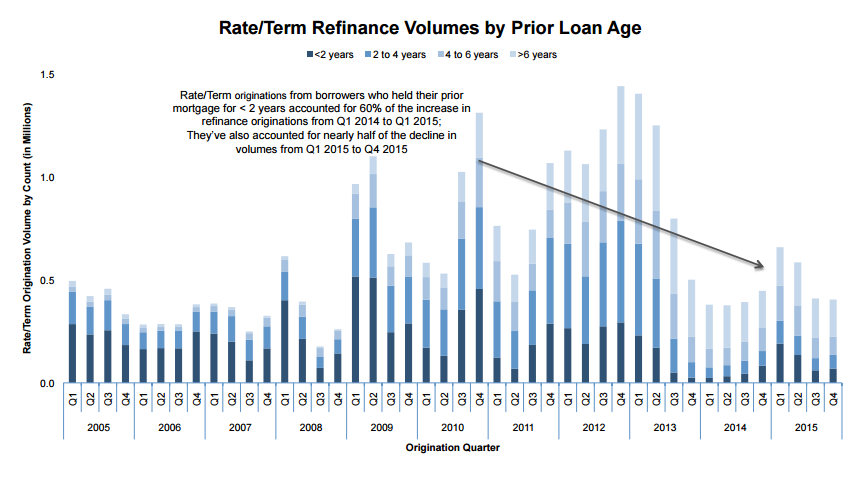
The current Mortgage Monitor also looked at recent refinances and found that so-called "serial refinances" driven by interest rate fluctuations played a large role in the rise and fall of refi origination volumes throughout 2015.
The numbers of rate and term refinances originated for borrowers who had held their previous mortgages for less than two years rose 800 percent from Q1 2014 to Q1 2015 as interest rates dropped. Then as rates rose toward the end of 2015, those refinancing short-term mortgages holders dropped by nearly 65 percent. Two-thirds of rate/term refinances in Q4 2015 were of loans that had been originated more than four years earlier.
In addition, Black Knight found that term reductions have become an increasingly popular part of refinance transactions, with 37 percent of rate/term refinances in Q4 2015 including a term reduction. These two trends are linked, as term reductions are more popular among loans of a greater age, as those borrowers are understandably more hesitant to restart the clock on their mortgages.
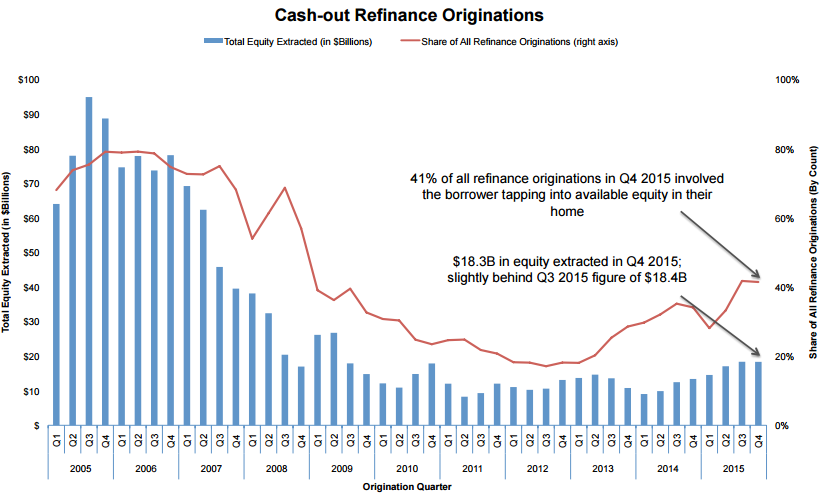
Cash-out refinances also increased in popularity. An estimated $68 billion in equity was withdrawn in refinance transactions in 2015 - the most since 2009 and a 53 percent increase over 2014. Cash-out refinance borrowers continue to represent a relatively low risk profile for lenders; the average post-cash-out LTV is 67 percent, with an average credit score of just under 750.