
Home price gains continued strong in January with the S&P/Case-Shiller indices closely tracking three of the four other major January home price reports. Case-Shiller's National Home Price Index which covers all nine U.S. census divisions rose 5.4 percent from January 2015 to January 2016 the same year-over-year increase as reported in December. The National Index was unchanged from December on an unadjusted basis but when seasonally adjusted the index rose 0.5 percent.
Earlier the Federal Housing Finance Agency (FHFA) had put the monthly increase in its purchase only House Price Index at 0.5 percent and the yearly gain slightly higher than Case-Shiller at 6.0 percent and Black Knight Financial Services reported increases of 0.1 percent and 5.3 percent respectively. CoreLogic's index was an outlier with a 1.4 percent monthly increase in January and a 6.9 percent year-over-year gain.
Case-Shiller's 10-City Composite Index rose 5.1 percent for the year and the 20-City Composite was up 5.7 percent. Each index was also unchanged on an unadjusted monthly basis but the 10-City rose 0.8 percent and the 20-City was up 0.7 percent when seasonally adjusted.
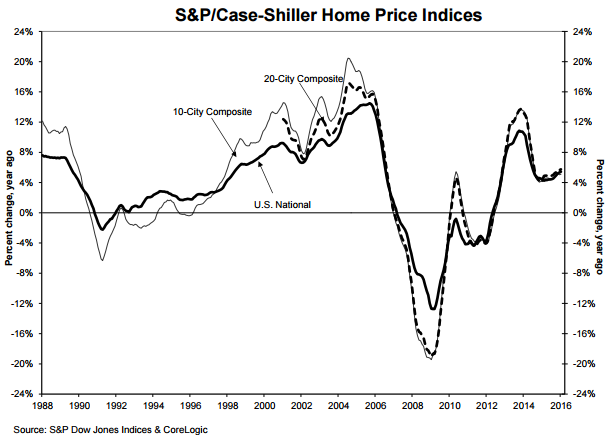
Analysts polled by Econoday were precisely on target with their 20-city projection, a consensus of 0.7 percent. The yearly figure was at the bottom of the estimated range of 5.7 to 6.3 percent but only slightly off of the consensus of 5.8 percent. In advance of the Case-Shiller release Bloomberg had noted the consensus was well short of outside expectations for 10 percent appreciation in 2016, but given the weakness in wages, home prices could be key to household wealth this year.
The West drove much of the appreciation in the city composites. Portland, Seattle, and San Francisco posted another month of double digit annual price increases; Portland at 11.8 percent, Seattle with 10.7 percent and San Francisco at 10.5 percent. Eleven of the 20 cities had greater annual increases in January than in December on an unadjusted basis but Phoenix's annual gain of 6.1 percent was down by 0.2 percentage points from December, ending its 12-month streak of growing annual increases. All 20 cities had larger gains than in December on a seasonally adjusted basis. The West overall was the strongest region for price appreciation and the Northeast division was weakest.
"Home prices continue to climb at more than twice the rate of inflation," says David M. Blitzer, Managing Director and Chairman of the Index Committee at S&P Dow Jones Indices. "The low inventory of homes for sale -- currently about a five month supply - means that would-be sellers seeking to trade-up are having a hard time finding a new, larger home. The recovery of the sale and construction of new homes has lagged the gains seen in existing home sales. This may be starting to change: starts of single family homes in February were the highest since November 2007. The single-family-home share of total housing starts was 70% in February, up from a low of 57% in June 2015, and approaching the 75%-80% range seen before the housing crisis.
"While low inventories and short supply are boosting prices, financing continues to be a concern for some potential purchasers, particularly young adults and first time home buyers. The issue is availability of credit for people with substantial student or credit card debt. While rising home prices are certainly a factor deterring home purchases, individual financial positions are more important than local housing market conditions. One hopeful sign is that the home ownership rate, at 63.7% in the 2015 fourth quarter, may be turning around. It is up slightly from 63.5% in the 2015 second quarter but far below the 2004 high of 69.1%."
As of January average home prices tracked by the 10-City and 20-City indices are back to their winter 2007 levels. Measured from the peaks they reached in June/July 2006 the two are down by 11-13 percent and have recovered by 34.5 percent and 36.2 percent respectively since hitting bottom in March 2012.
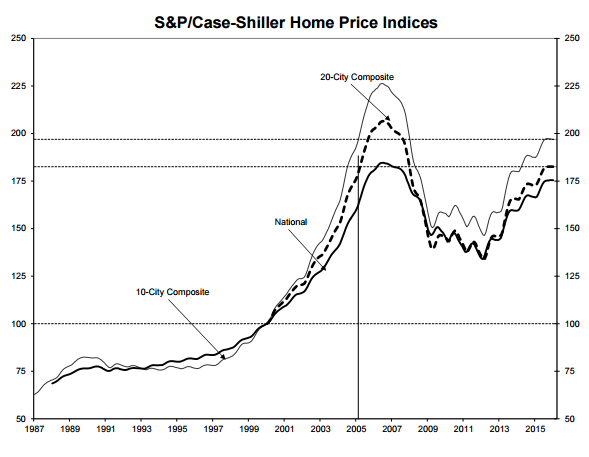
The S&P/Case-Shiller Home Price Indices are constructed to accurately track the price path of typical single-family home pairs for thousands of individual houses from the available universe of arms-length sales data. The S&P/Case-Shiller National U.S. Home Price Index tracks the value of single-family housing within the United States. The indices have a base value of 100 in January 2000; thus, for example, a current index value of 150 translates to a 50 percent appreciation rate since January 2000 for a typical home located within the subject market.
The 10-City Composite currently has an index level of 196.93 and the 20-City a value of 182.56. The National Index is at 175.42. Detroit has the lowest index value at 103.59 and Los Angeles has the highest at 241.61.


