
Even though home prices have increased in a more or less uninterrupted pattern since early 2012 a joint report form RealtyTrac and Clear Capital puts buying a home in the first quarter of 2015 at the most affordable level in two years.
RealtyTrac analyzed Q1 2015 average weekly wage data from the Bureau of Labor Statistics, average condo and single-family home prices taken from publicly recorded sales deed data in 582 U.S. counties, and average interest rates for 30 year fixed rate mortgages from Freddie Mac's Primary Mortgage Market Survey. Clear Capital analyzed data from its Home Data Index to determine counties at highest risk and lowest risk based on affordability and potential for price growth.
Since bottoming out in the first quarter of 2012, the average U.S. home price has risen 24 percent while the average weekly wage nationwide has risen 7 percent and the average interest rate on a 30-year fixed rate mortgage has moved slightly lower. If we compare the current situation to 2006, when affordability was at its worst levels in the last 10 years, we see the average home price remains 12 percent lower, the average wage nationwide has risen 34 percent, and the average interest rate on a 30-year fixed rate mortgage has dropped 44 percent. Talk about a recipe for affordability! Today's report suggests affordability is up 48 percent over that time.
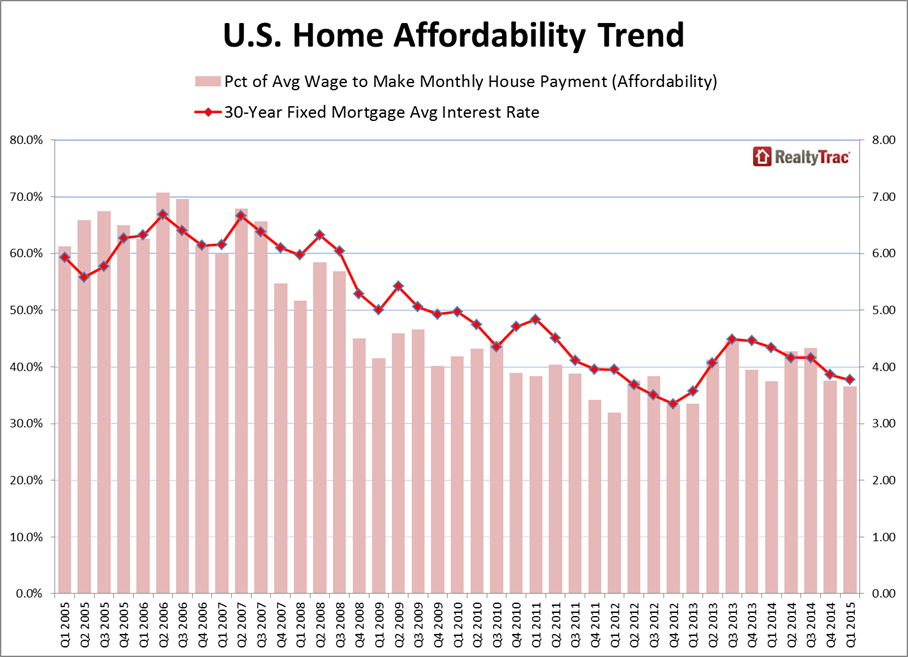
RealtyTrac concluded that, with a 3 percent down payment, monthly payments on an average priced U.S. home (principle. Interest, taxes, insurance, and PMI) required 36.5 percent of the average wage nationwide in the first quarter of 2015 compared to 37.4 percent in the first quarter of 2014 and the lowest since the first quarter of 2013, when affordability was 33.5 percent. Housing costs reached the lowest level in 10 years during the first quarter of 2012 when payments required 32.0 percent of average wages and were at the highest level in the second quarter of 2006 when they consumed 70.7 percent of average wages.
But it was also clear that average wage growth between the first quarter of 2013 and the same quarter in 2015 did not keep pace with average home price appreciation during the same period in 68 percent of the counties. Average interest rates, however, did drop by 57 basis points during the same period from 4.34 percent in early 2014 to 3.77 percent a year later. The drop in interest rates - along with wage growth outpacing home price appreciation in 32 percent of counties - meant buying a home in the first quarter of 2015 required a smaller share of the average wage compared to a year ago in 339 of the 582 counties (58 percent).
"Although home prices continue to outpace wage growth in the majority of local markets, this analysis somewhat surprisingly shows that affordability is actually improving in most markets thanks to falling interest rates and slowing home price growth, which is allowing wage growth to catch up in some markets," said Daren Blomquist, vice president at RealtyTrac. "At the national level, buying an average-priced home in the first quarter of 2015 was the most affordable it's been in two years and nearly twice as affordable as it was in the second quarter of 2006 - when affordability was its worst in the past 10 years. At the local level we're seeing several bellwether markets where wage growth matched or even outpaced home price growth over the past year."
Major markets where wage growth outpaced home price growth in the first quarter - counter to the national trend - included Cook County, Illinois; Orange County, California; Brooklyn, New York; and Fairfax County, Virginia. In Riverside County, California, the average weekly wage in the first quarter was up 10 percent from a year ago, double the 5 percent growth in average home prices during the same time period.
Among all 582 counties analyzed in the report, only 20 (3 percent) exceeded their 10-year affordability averages in the first quarter of 2015, including counties in the Nashville, Lansing, Michigan, Cincinnati, Memphis, Washington, D.C., and Atlanta metro areas.
The report uses hypotheticals to make some possible future affordability scenarios. For example, a 25 basis point increase in mortgage interest rates from Q1 2015 to Q1 2016 (to 4.02 percent) while home prices and wages maintain their Q1 2015 growth rates would push 76 counties (13 percent) above their historic affordability averages. A 50 basis point rise (to 4.27 percent) would similarly affect 92 counties (16 percent) and with a full percentage point increase to 4.77 percent would do so to 131 or 23 percent of the counties.
The least affordable counties in the first quarter were led by Eagle County, Colorado, where 138.5 percent of the average wage was needed to make monthly payments on an average priced home. It was followed by Kings County (Brooklyn), (126.3 percent), Marin County (119.3 percent) and Santa Cruz County, California (109.0 percent), and Maui County, Hawaii (99.2 percent).
The most affordable county was Hamilton County, Florida, where 5.6 percent of the average wage was needed to make monthly payments on an average priced home. Other counties in the top five most affordable were Saint Louis County (8.3 percent), Saint Louis City (9.4 percent), Lake County, Indiana (9.5 percent), and Fairfield County, South Carolina (10.3 percent).


