
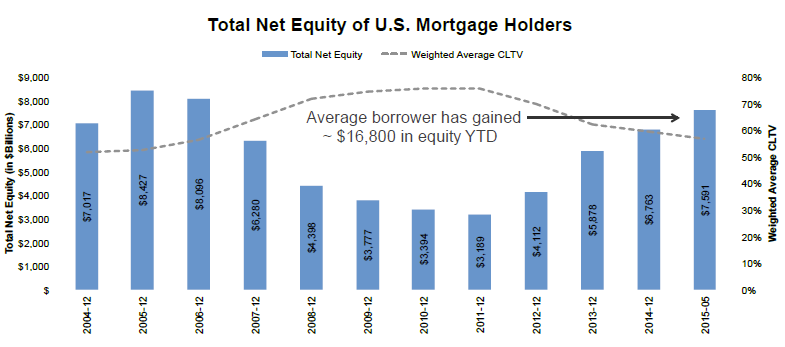
Nationwide home equity has increased by nearly $1 trillion in the 12 months ended in May. Equity is now at the highest level since 2007. In this month's Mortgage Monitor Black Knight Financial Services look at topics related to that growing equity; where it is, what homeowners might do with it, and the continuing repercussions from what they have done about it in the past.
Black Knight Data & Analytics Senior Vice President Ben Graboske said, "We've seen total home equity in the mortgage market expand by $825 billion in just the first five months of this year. At $7.6 trillion, total net equity is nearly 2.5 times more than it was at the end of 2011, and is at the highest level it's been since the start of the housing crisis. To put this growth in perspective, consider that the average American homeowner with a mortgage has about $19,000 more equity in his or her home today than a year ago.
Including both first and second liens the national as a whole has a combined loan to value ratio (CLTV) of about 57 percent. Graboske points out that this growth in available equity has direct implications for borrowers' ability to access the equity in their homes.
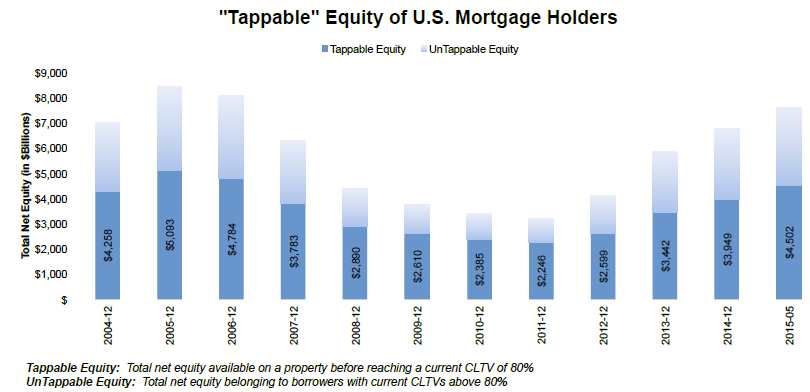
Using the amount of equity available on each home with a mortgage (with a CLTV of 80 percent as an upper limit), "we see that 59 percent of total net equity could be accessed by borrowers before hitting that limit," he says. So in total there are over 37 million borrowers that have what Black Knight calls "tappable" equity. The company puts the range from an average of about $42,000 for those homeowners in the bottom 20 percent of home value to $267,000 for those in the top 20 percent, a nationwide average of $120,000.
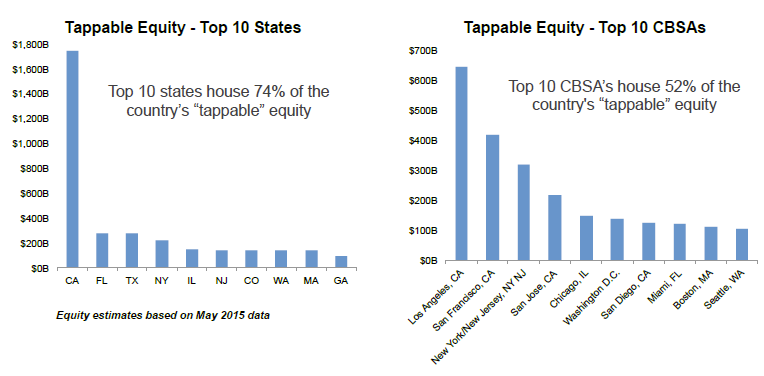
But we have here yet another example of location, location. Black Knight found that, of the $4.5 trillion in tappable equity, $1.7 trillion - or 39 percent - is in California, dwarfing by a factor of six the second state, Florida, with an estimated $278 billion. Los Angeles alone has 14 percent of the nation's total available equity. By volume, the top 10 states ranked by available equity account for 74 percent of total tappable equity, while the top 10 metro areas account for over half.
At the beginning of the year - and as Black Knight points out, there has been a healthy increase since them - tappable equity was only 17 percent below where it was at the start of 2007. So are homeowners about to go crazy and cash out that equity? Not so far at least. In Q1 there was a 40 percent increase in originations of home equity lines of credit (HELOCs) compared to Q1 2014, but those originations remained 85 percent below their 2007 level but with the highest weighted average credit scores on record, nearly 40 points higher than in 2005,.
Black Knight says tight lending requirements are still limiting second lien originations but that may not be enough to keep them down if homeowners decide to liquidate a bit of this value. Sixty percent of the country's tappable equity belongs to borrowers with credit scores over 760 and 18 percent to those with scores from 720 to 759.
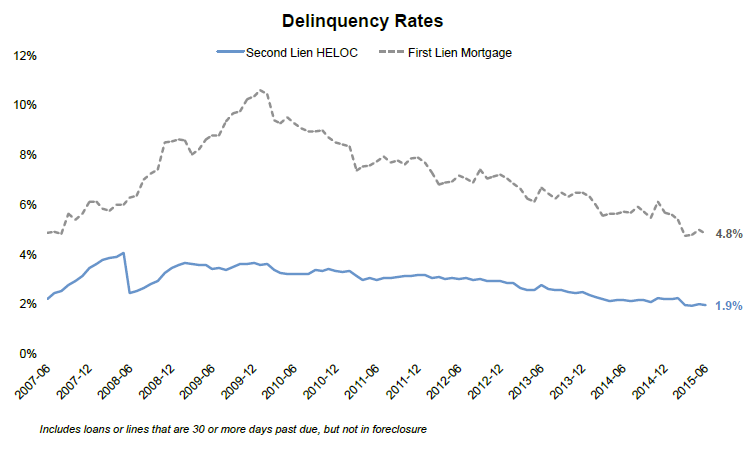
"There is no question that HELOCs being originated today are of exceptional credit quality," said Graboske. "In fact, HELOC originations in Q1 2015 had the highest weighted average credit score on record. In addition, HELOC delinquency rates are at the lowest level since April 2007." Those rates, currently at 1.9 percent, have declined by over 11 percent thus far this year, slightly less than the 16 percent drop in first mortgage delinquencies.
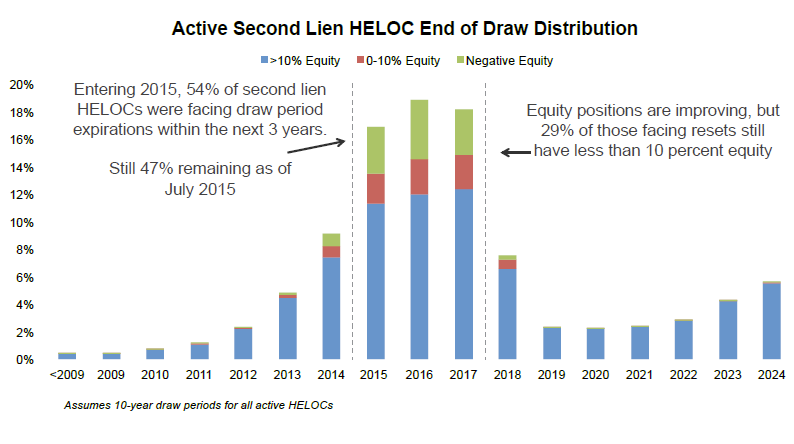
That said, Black Knight cautions that nearly half of all existing HELOCS, a total of 3 million borrowers, will see their draw period expire over the next two-and-a-half years and they are facing payment shocks that will see payments increase about $250 per month on average. About 550,000 to 600,000 homeowners will confront this situation in the next six months. Further, while equity positions are improving, 29 percent of those facing resets still have less than 10 percent equity in their homes, making refinancing their way out of payment shocks problematic.
As an example of what might be ahead, Graboske points to new non-current HELOC rates. The numbers of loans that were current six months earlier but are now 60 or more days past due have risen 44 percent year-over-year among that group originated in 2005 and total delinquencies among that vintage loan are up 19 percent year-to-date. He says, "This remains a situation that bears close watching."


