
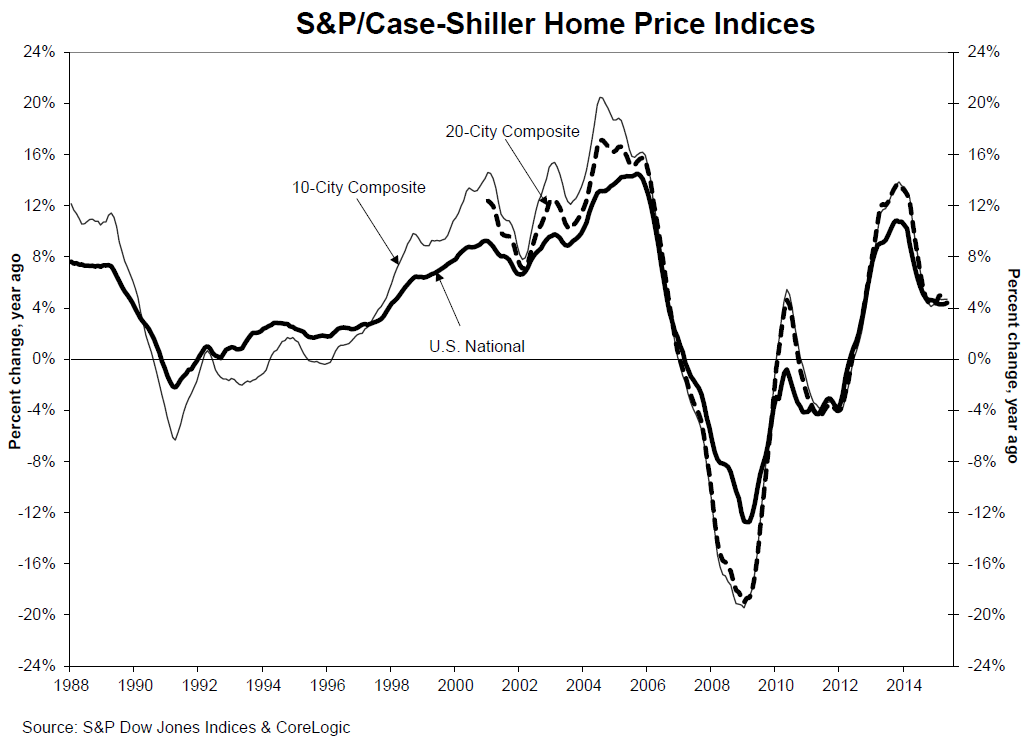
Home price data from S&P Dow Jones Indices was mixed for May. All three of the Case-Shiller measures, the National Index and the 10-City and 20-City Composites increased from May 2014 but the year-over-year increases were about the same as in April with the National and 10-City increasing marginally and the 20-City posting a slightly smaller gain.
The National Index, which covers all nine census divisions, recorded a 4.4% annual increase in May 2015 versus a 4.3 percent increase in April 2015. The 10-City Composite was up 4.7 percent and the 20 City increased 4.9 percent - differences between the two months in both cases were lost in rounding.
Ten cities reported greater annual gains in May than in April. Denver, San Francisco, and Dallas led the 20 cities with price increases of 10.0%, 9.7% and 8.4%, respectively. New York and Phoenix reported six consecutive months of increases dating back to November 2014. Year-over-year returns in New York increased from 1.3% in November 2014 to 3.0% in May 2015, and Phoenix climbed from 2.0% to 3.8% in the same period.
The Case-Shiller report usually concentrates on its seasonally adjusted numbers but they made a point of their differences in May from non-adjusted data. Before seasonal adjustment, they said, all three indices for May posted a gain of 1.1% month-over-month. However, after seasonal adjustment, the National index was unchanged and the 10-City and 20-City Composites were both down 0.2% month-over-month. All 20 cities reported increases in May before seasonal adjustment; after seasonal adjustment, 10 were down, eight were up, and two were unchanged.
"As home prices continue rising, they are sending more upbeat signals than other housing market indicators," says David M. Blitzer, Managing Director and Chairman of the Index Committee at S&P Dow Jones Indices. "Nationally, single family home price increases have settled into a steady 4 percent -5 percent annual pace following the double-digit bubbly pattern of 2013. Over the next two years or so, the rate of home price increases is more likely to slow than to accelerate. Prices are increasing about twice as fast as inflation or wages. Moreover, other housing measures are less robust. Housing starts are only at about 1.2 million units annually, and only about half of total starts are single family homes. Sales of new homes are low compared to sales of existing homes.
"First time homebuyers are the weak spot in the market. First time buyers provide the demand and liquidity that supports trading up by current home owners. Without a boost in first timers, there is less housing market activity, fewer existing homes being put on the market, and more worry about inventory. Research at the Atlanta Federal Reserve Bank argues that one should not blame millennials for the absence of first time buyers. The age distribution of first time buyers has not changed much since 2000; if anything, the median age has dropped slightly. Other research at the New York Fed points to the size of mortgage down payments as a key factor. The difference between a 5 percent and 20 percent down payment, particularly for people who currently rent, has a huge impact on buyers' willingness to buy a home. Mortgage rates are far less important to first time buyers than down payments."
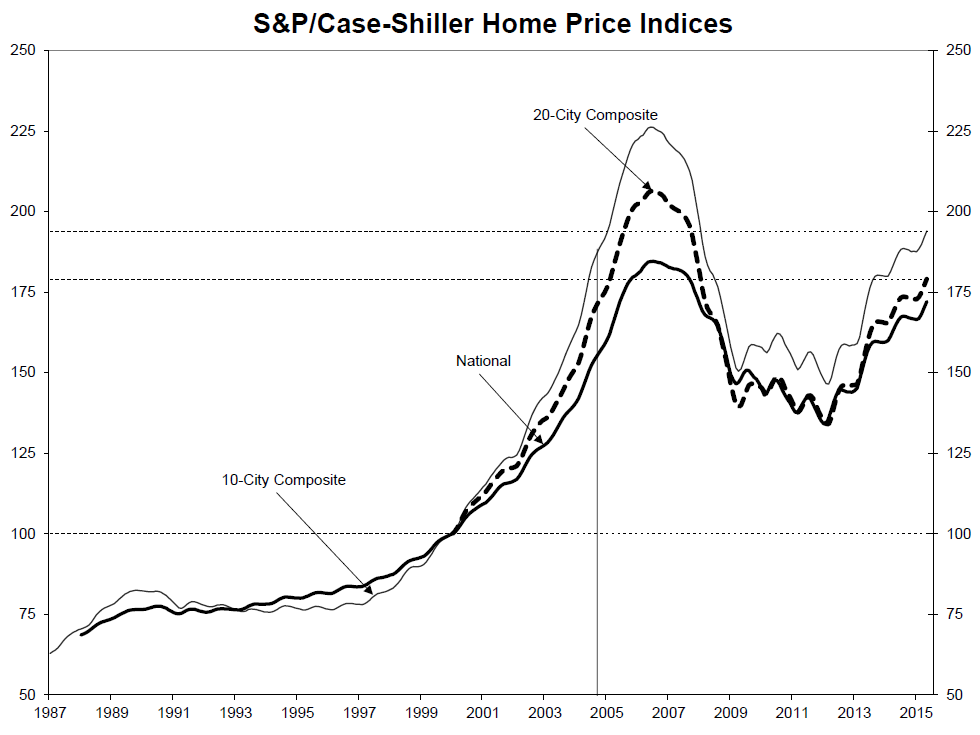
As of May average home prices for the metropolitan areas within the two city composites are back to winter 2005 levels and their decline from the peaks reached in the summer of 2006 range from 13 to 15 percent. Since the March 2012 lows, the 10-City and 20-City Composites have recovered 32.5 percent and 33.5 percent respectively.
The S&P/Case-Shiller home Prices Indices are constructed to track the price path of typical single-family homes located in each of the metropolitan areas. Each index combines matched price pairs for thousands of homes compiled from arms-length sales data. The National Index tracks single-family home values within the U.S. The indices have a base value of 100 in January 2000 so a value of 150 translates to a 50 percent appreciation rate since that time. The current National Index is 172.08 and the 10-City and 20-City stand at 194.00 and 179.03.


