
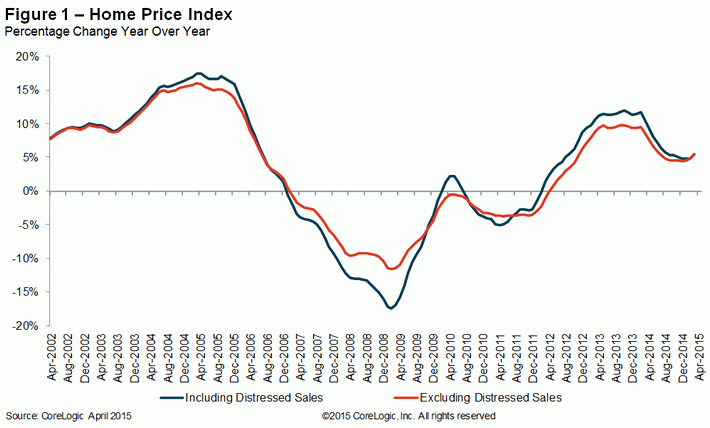
For some time conventional wisdom has held that home price increases are slowing and would continue to do so, but the CoreLogic Home Price Index (HPI) has joined the S&P Dow Jones Case-Shiller Index in belying that prediction. Its HPI has now posted larger year-over-year increase in prices every month but one since the beginning of 2015.
The HPI which includes distressed sales increased by 6.8 percent in April 2015 compared to April 2014. In March that increase was 5.9 percent, in February 5.6 percent, and in January 5.7 percent. The April number represents 38 months of annual increases nationally.
On a month-over-month basis the index jumped 2.7 percent. It had risen 2.0 percent in March and was up 1.1 percent in each of the preceding two months. CoreLogic had forecast a 0.8 percent gain.
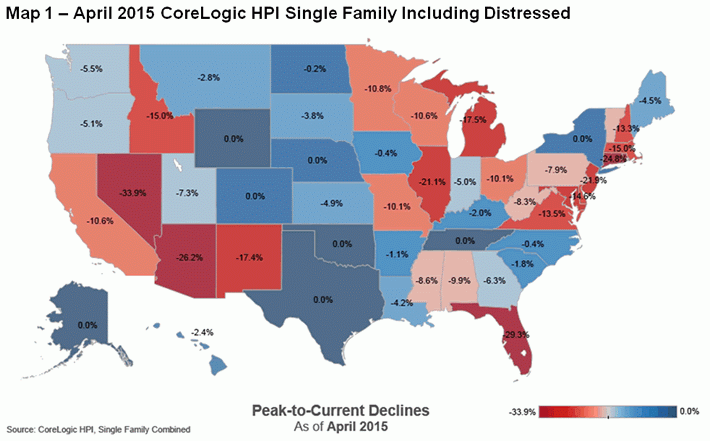
Including distressed sales, 30 states plus the District of Columbia were at or within 10 percent of their peak prices in April. Eight states, Alaska, Colorado, Nebraska, New York, Oklahoma, Tennessee, Texas and Wyoming, and the District of Columbia reached the highest index levels since CoreLogic began collecting data in January 1976.
The five states with the highest annual home price appreciation were: South Carolina (+11.4 percent), Colorado (+9.7 percent), Washington (+9.1 percent), Florida (+9 percent) and Texas (+8.3 percent). Including distressed sales, four states experienced year-over-year home price depreciation: Massachusetts (-1.7 percent), Louisiana (-1.5 percent), Connecticut (-1.1 percent) and Maryland (-0.7 percent).
Excluding distressed sales (short sales and sales of REO), home prices increased by 6.8 percent in April 2015 compared with April 2014 and increased by 2.3 percent from March (the forecast was 0.7 percent). The five states with the highest home price appreciation were: South Carolina (+10 percent), Florida (+9.5 percent), Colorado (+9.3 percent), Washington (+8.7 percent) and Texas (+8.2 percent). Two states, South Dakota and Louisiana, depreciated by a fraction of a percent year-over-year.
"For the first four months of 2015, home sales were up 9 percent compared to the same period a year ago," said Frank Nothaft, chief economist for CoreLogic. "One byproduct of the increased sales activity is rising house prices, and, as a result, month-over-month home prices are up almost 3 percent for April 2015 and up more than 6 percent from a year ago."
Including distressed transactions, the peak-to-current change in the national HPI (from April 2006 to April 2015) was -9 percent. Excluding distressed transactions, the peak-to-current change for the same period was -5.1 percent.
CoreLogic forecasts that home prices, including distressed sales will increase by 1.1 percent month over month from April 2015 to May 2015 and by 5.3 percent on a year-over-year basis from April 2015 to April 2016. Excluding distressed sales, home prices are projected to increase by 0.9 percent month over month from April 2015 to May 2015 and by 4.9 percent on a going-forward annual basis. The CoreLogic HPI Forecast is a projection of home prices using the CoreLogic HPI and other economic variables.
"Old fashion supply and demand, fueled by historically low mortgage rates and improving consumer finances and confidence, continue to push home prices up," said Anand Nallathambi, president and CEO of CoreLogic. "We expect continued price appreciation throughout 2015 and into next year. Over the longer term, household formation, up by more than one million over the past year alone, will drive down vacancy rates and create tighter housing markets in many metropolitan areas. This should provide the necessary underpinning for rising prices for the foreseeable future."
Of the top 100 Core Based Statistical Areas (CBSAs) measured by population, 92 showed year-over-year increases. The eight CBSAs that showed year-over-year declines were: Baltimore, Camden, New Jersey; Hartford, New Orleans; Worcester, Massachusetts; Albany, New Haven, and Wilmington, Delaware.


