
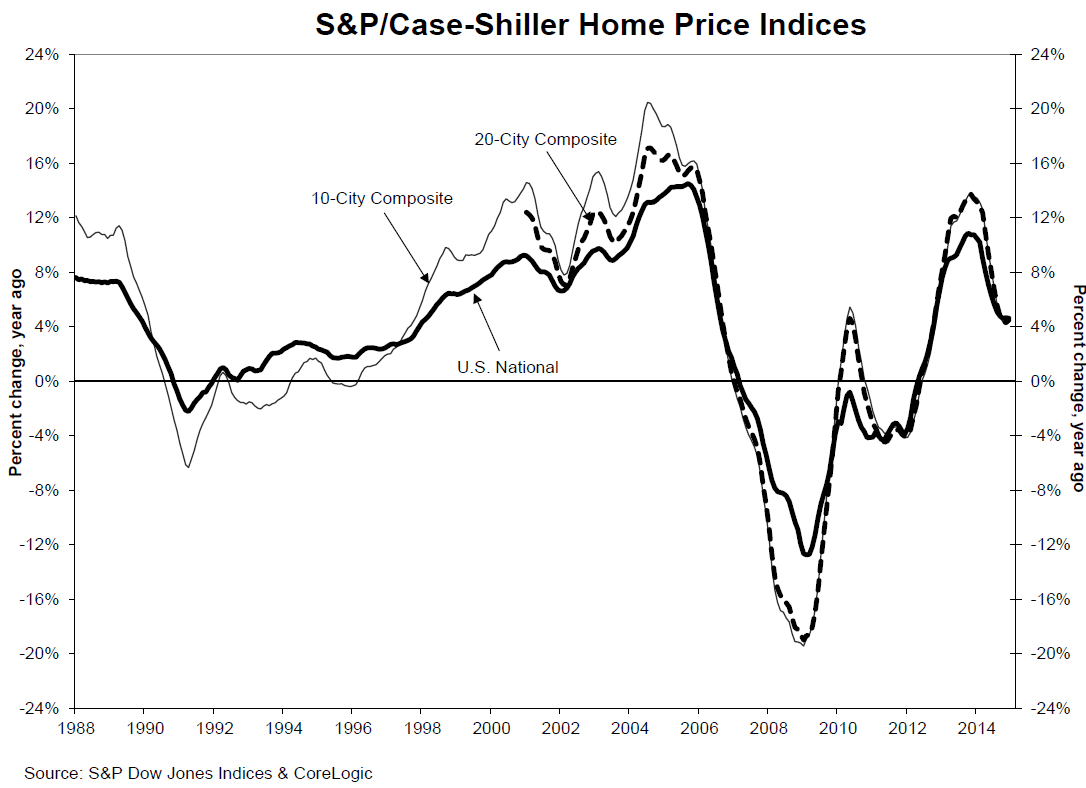
Despite increases in 2014 that were twice that of inflation, house prices are "faltering." The S&P/Case-Shiller composite city indices for December were nearly flat while the National index was slightly negative.
Both the 10-City and 20-City Composite indices posted year-over-year increases in December compared to those increases in November. The 10-City had an annual gain of 4.3 percent compared to 4.2 percent in November, the 20-city was up 4.5 percent compared to 4.3 percent the previous month. The National Home Price Index (HPI) had an annual gain of 4.6 percent against 4.7 percent in November.
Both Composites reported small month-over-month increases of 0.1 percent. The National Index, which covers the nine U.S. Census districts, lost 0.1 percent compared to November.
David M. Blitzer, Managing Director and Chairman of the Index Committee at S&P Dow Jones Indices said, "The housing recovery is faltering. While prices and sales of existing homes are close to normal, construction and new home sales remain weak. Before the current business cycle, any time housing starts were at their current level of about one million at annual rates, the economy was in a recession. The softness in housing is despite favorable conditions elsewhere in the economy: strong job growth, a declining unemployment rate, continued low interest rates and positive consumer confidence."
The fastest year-over-year gains were in San Francisco and Miami, where prices rose 9.3 percent and 8.4 percent. Twelve cities, including Cleveland, Denver, and Seattle, saw prices rise faster in the year to December than a month earlier. Las Vegas led the declining annual returns with 6.9 percent, down from 7.7 percent annually.
Nine cities of the 20 cities included in the composites reported monthly price increases with Miami and Denver on top with gains of 0.7 and 0.5 percent respectively. At the other extreme were six states with lower prices than in November led by Chicago and Cleveland with respective decreases of 0.9 and 0.5 percent. In the remaining five metro area prices were described as flat.
Blitzer said there were clear regional patterns in the price movements in home prices showed clear regional patterns. "The western half of the nation plus Miami and Atlanta enjoyed year-over-year increases of 5 percent or more. San Francisco and Miami were the strongest. Dallas, Denver, Las Vegas and Atlanta also experienced solid gains. Phoenix was an exception to the western strength with only a 2.4 percent increase; San Diego was a bit under 5 percent at 4.8 percent. The Midwest and Northeast lagged. Boston was the strongest among this weak group with prices up 3.8 percent. The regional patterns and the weakness in new construction and new sales may reflect decreasing mobility - fewer people moving to different parts of the country or seeking jobs in different regions."
As of December the average home prices for metro areas within the 10- and 20-City Composites are back to autumn 2004 levels and have declined from their June/July 2006 levels by 16 to 17 percent. The Composites have recovered from their March 2012 troughs by 28.2 percent for the 10-City and 29.1 percent for the 20-City. Detroit is the only metro area that remains below the index baseline of 100 at 97.21.
The S&P/Case-Shiller Home Price Indices are constructed to track the price path of typical single-family homes located in each of the tracked metropolitan areas. Each index combines matched price pairs for thousands of individual houses from the available universe of arms-length sales data. The S&P/Case-Shiller National U.S. Home Price Index tracks the value of single-family housing within the United States. The index is a composite of single-family home price indices for the nine U.S. Census divisions. The indices have a base value of 100 in January 2000; thus, for example, a current index value of 150 translates to a 50 percent appreciation rate since January 2000 for a typical home located within the subject market.


