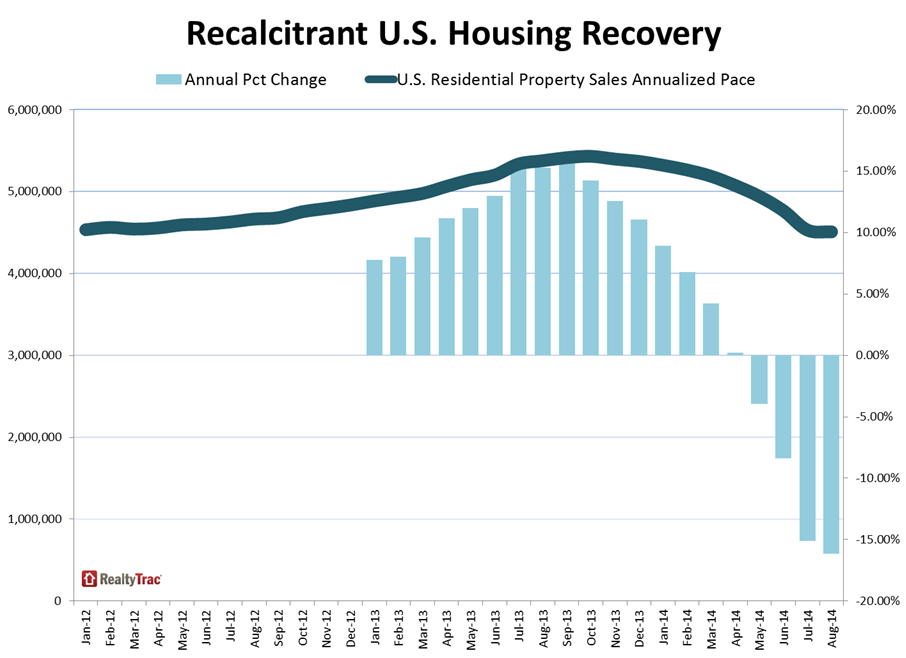
RealtyTrac estimated on Thursday that sales of residential property including single family homes, condominiums, and townhomes set an annual pace of 4.51 million units in August. This is down .05 percent from July and is 16 percent below the pace one year earlier. The California company said it was the fourth consecutive month when annualized sales were lower than the same month the previous year.
There are many more estimates of home price trends each month than of home sales but the handful of private companies and public agencies that provide sale data all use different data sets and criteria. The National Association of Realtors (NAR) reports on sales of existing homes while the Census Bureau covers sales of newly constructed homes. The Mortgage Bankers Association (MBA) also estimates new home sales based on the applications its members receive for mortgages to finance such purchases. It is thus difficult to draw any conclusions about the accuracy of any of the estimates.
However, for comparison purposes, NAR this week put the pace of residential sales in August at 5.05 million, down 1.8 percent from July. The Census reported an 18 percent monthly increase in the pace of new home sales to a six year high of 504,000 units while MBA estimated those sales at 424,000, a 9 percent drop from July.
Prices continue to rise but the rate of increase is moderating. The median price of a property sold in August, both distressed and market rate, was $195,000, a 3 percent increase from July and up 15 percent from a year earlier. The August median was a six-year high.
Distressed sales (short sales, bank-owned real estate or sales at foreclosure auction) accounted for 13.5 percent of properties sold in August, up from 10.7 percent in July but 8 basis points below distressed sales in August 2013. The median price of distressed sales was $129,000, 15 percent higher than a year earlier but well below the $205,000 median price of equity sales.
The higher median price can be attributed in part to a skewing of the market toward higher end properties, again in part to declining levels of distressed sales. The share of sales in the $200,000-and-below price range was down 9 percent from a year ago, while the share of sales in the above-$200,000 price range increased 10 percent from a year ago.
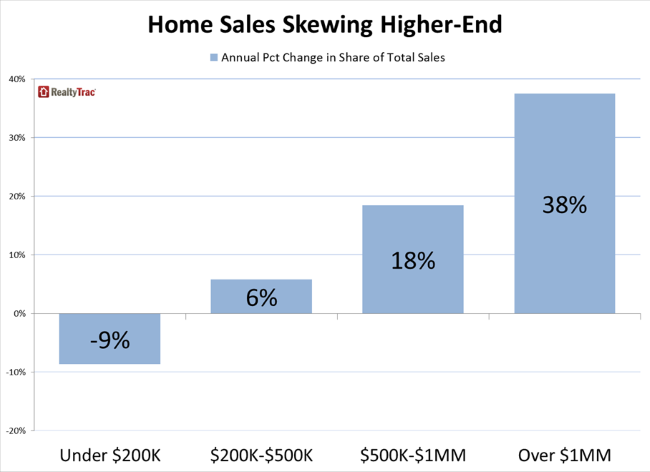
A closer look at the $200,000 plus segment shows that sales in the $500,000-to-$1 million price range increased 18 percent from a year ago while the share of sales in the over-$1 million price range increased 38 percent. Combined this is an increase of 23 percent in the share of sales above $500,000.
"Higher-end properties are taking up a bigger share of a smaller home sales pie, boosting the median home price nationwide higher even as home price appreciation slows to single digits in many of last year's red-hot local housing markets," said Daren Blomquist, vice president at RealtyTrac. "On the other hand, markets where large institutional investors and other buyers have not picked clean lower-priced inventory are continuing to see strong, double-digit increases in median home prices."
Among 197 metropolitan statistical areas with a population of 200,000 or more and sufficient sales data to analyze, 124 (63 percent) saw lower annual home price appreciation in August 2014 than in August 2013. This held true as well in 36 of the 50 larger markets and in 18 of the 20 largest ones. These decelerating markets included San Francisco where there was a 9 percent annual price gain compared to 37 percent the previous August, Los Angles which dropped from 27 percent to 7 percent, Atlanta, down from 27 to 10 percent; Phoenix (25 percent to 6 percent); and Las Vegan which fell to 8 percent from 26 percent.
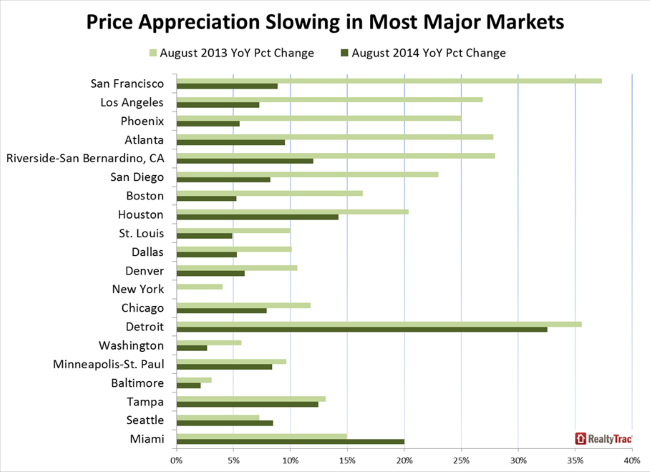
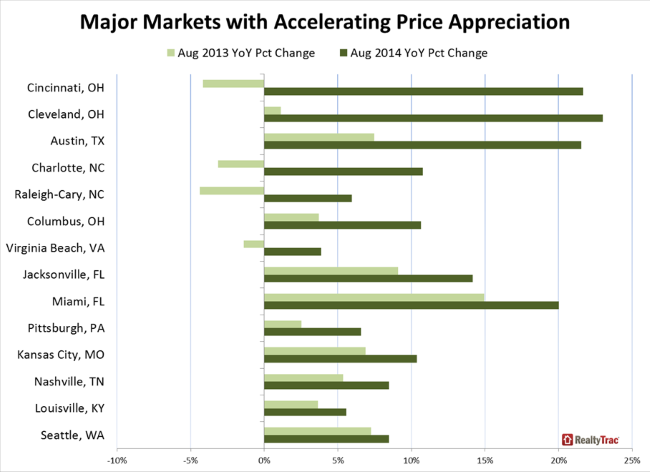
Home price hot spots do still remain. Cincinnati's price gains increased from 4 percent in August 2013 to 22 percent last month and Cleveland from 1 percent to 23 percent. Twenty-two of the 197 major markets reached new median price peaks including Pittsburgh, Cincinnati, Columbus, Charlotte, and Austin.