
All three home price surveys released this morning showed prices increased in March, a more moderate improvement than in previous months in some cases, but still broad based. The S&P Case-Shiller Home Price Indices, showed that prices increased month-over-month in 19 of the 20 cities it tracks, Black Knight in 49 states, and FHFA said 42 states and the District of Columbia posted increases in the first quarter of 2012.
The Case-Shiller 10 City Composite Index gained 0.8 percent in March and the 20-City was up 0.9 percent. The quarterly National Index rose 0.2 percent in the first quarter of 2013. San Francisco's HPI increased another 2.4 percent in March and Dallas and Denver set new index peaks with March increases of 1.2 and 1.4 percent respectively. New York was the only city among the 20 to decline, posting a 0.3 percent drop, for March but all 20 cities had positive annual returns although 13 of the 20 posted lower annual returns in March than in February.
The annual gains in both the National and Composite indices slowed significantly. The National Index gained 10.6 percent from March 2013 to March 2013 while the 10-City increased 12.6 percent and the 20-City 12.4 percent. In the fourth quarter the National Index was up 11.3 percent on an annual basis while in February the 10-city and 20-City had annual increases of 13.1 percent and 12.9 percent respectively. Chicago showed its highest year-over-year return since December 1988, 11.5%. Las Vegas and San Francisco, the cities with the highest returns, saw their rates of gain slow to approximately 21%; their post-crisis peak returns were 29.2% and 25.7%. At the lower end was Cleveland with a gain of 3.9% in the 12 months ending March 2014.
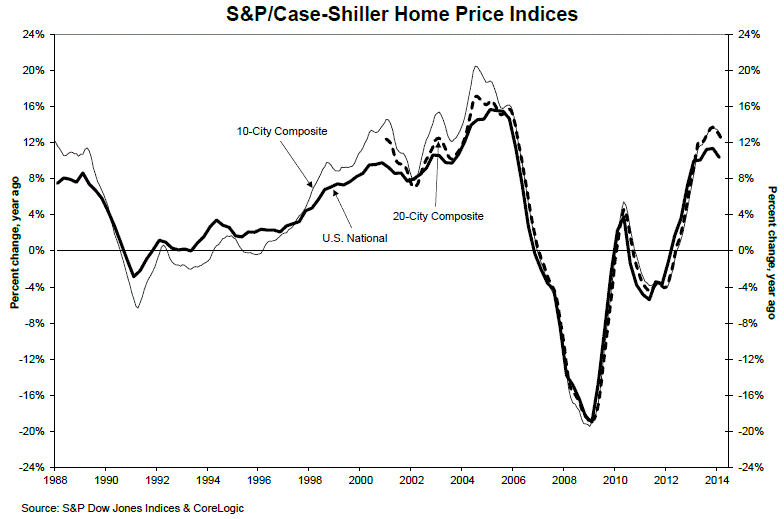
The year-over-year changes suggest that prices are rising more slowly," says David M. Blitzer, Chairman of the Index Committee at S&P Dow Jones Indices. "Annual price increases for the two Composites have slowed in the last four months and 13 cities saw annual price changes moderate in March. The National Index also showed decelerating gains in the last quarter. Among those markets seeing substantial slowdowns in price gains were some of the leading boom-bust markets including Las Vegas, Los Angeles, Phoenix, San Francisco and Tampa.
Housing indicators remain mixed, Blitzer said. "April housing starts recovered the drop in March but virtually all the gain was in apartment construction, not single family homes. New home sales also rebounded from recent weakness but remain soft. Mortgage rates are near a seven month low but recent comments from the Fed point to bank lending standards as a problem. Other comments include arguments that student loan debt is preventing many potential first time buyers from entering the housing market."
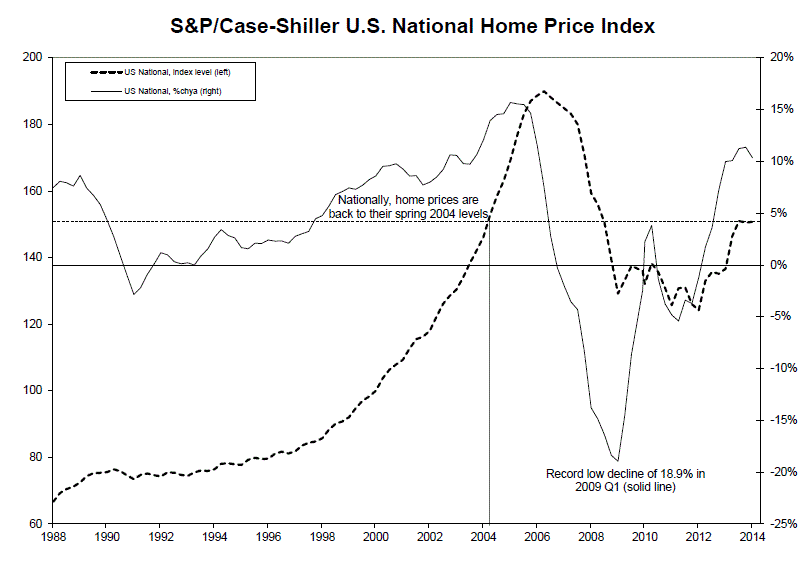
As of the first quarter of 2014, average home prices across the United States are back to the levels posted in the spring of 2004. At the end of the first quarter of 2014, the National Index was up 0.2% over the fourth quarter of 2013 and 10.3% above the first quarter of 2013. The two composite indices have returned to mid-2004 levels and measured from the June/July 2006 peaks are down approximately 19-20 percent and have recovered by about 24 percent from the March 2012 troughs.
FHFA's HPI rose 0.7 percent from February to March compared to a 0.6 percent increase in January. The annual increase was 6.5 percent. As noted there were first quarter increases in the HPI in 42 states and the District of Columbia compared to increases in 38 states during the fourth quarter of 2013. It was the 11th consecutive quarter the FHFA HPI has increased and the monthly seasonally adjusted purchase-only index for the U.S. has increased for 23 of the last 24 months
The states with the strongest annual appreciation were Nevada, the District of Columbia, California, Arizona, and Florida. Among the nine census divisions the Pacific Division had the strongest increase in the first quarter with a 2.1 percent increase and the region was up 13.2 percent from the previous year. On the monthly basis however the Pacific region had only a 0.4 percent increase, well below the national average and the 4.6 percent jump in New England and 1.2 percent in the West North Central region.
There were first quarter price increases in 71 of the 100 metropolitan areas tracked by FHFA with the strongest increase, 10.7 percent, in the Charleston, South Carolina area and the weakest in New Orleans, down 2.6 percent.
Black Knight said that its HPI for the nation as a whole was $235,000 in March, a 1 percent increase from the previous month and 12.8 percent below the peak in the index, $269,000, reached in June 2006. Colorado and Texas established new peak HPI's in March as they have done virtually every month since last summer.
Michigan and the District of Columbia had the largest month-over month increases at 1.6 percent each, followed by four states, Washington, Oregon, Illinois, and Georgia that increased 1.5 percent. Missouri and North Dakota were each up 1.3 percent and Minnesota and Nevada 1.2 percent.
Connecticut was the only state where the HPI declined from February to March, a slight loss of 0.1 percent. Three other New England states, while in positive territory, posted the worst performances in the country. Rhode Island increased 0.1 percent, Vermont 0.2 percent, and New Hampshire 0.3 percent.


