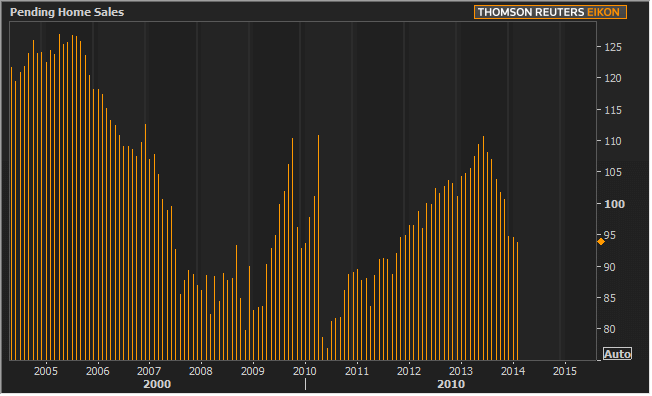
The National Association of Realtors® (NAR) Pending Home Sales Index (PHSI) for February added more confirmation of a slowing home housing market. The PHSI, released this morning, showed an eighth straight month of declining contract signings.
PHSI is a forward-looking indicator which tends to predict home sales over the ensuing 30 to 60 days. The Index was down 0.8 percent in February to 93.9 from a downwardly revised 94.7 in January. January had originally been estimated at 95.0. The February level is 10.5 percent below where the index was in February 2013 and is the lowest since October 2011 when it was 92.2.

However Lawrence Yun, NAR chief economist, was optimistic about the import of the pending sales data. He said the recent slowdown in home sales may be behind us, while home prices continue to rise. "Contract signings for the past three months have been little changed, implying the market appears to be stabilizing," he said. "Moreover, buyer traffic information from our monthly Realtor® survey shows a modest turnaround, and some weather delayed transactions should close in the spring."
All regions are below February 2013 levels but there were modest increases in the Midwest and West. The Index in the Northeast declined 2.4 percent to 77.1 in February, and is 7.4 percent below a year ago. The Midwest index rose 2.8 percent to 95.3, remaining 8.5 percent below a year earlier. Pending home sales in the South fell 4.0 percent from January to an index of 106.3 and are 9.3 percent below a year ago. The index in the West increased 2.3 percent in February to 86.1, but is 16.5 percent below February 2013.
Total existing-home sales are forecast at 5.0 million this year, just below the nearly 5.1 million in 2013. Housing starts are projected to rise almost 19 percent in 2014, and reach about 1.1 million, closer to the underlying demand of 1.5 million.
NAR said the gain in new home construction will reduce some of the pressure on home prices, with the national median existing-home price expected to rise in the range of 5.5 to 6 percent this year, compared with an 11.5 percent jump in 2013.
The Pending Home Sales Index is based on a large national sample, typically representing about 20 percent of transactions for existing-home sales. In developing the model for the index, it was demonstrated that the level of monthly sales-contract activity parallels the level of closed existing-home sales in the following two months. An index of 100 is equal to the average level of contract activity during 2001, which was the first year to be examined. By coincidence, the volume of existing-home sales in 2001 fell within the range of 5.0 to 5.5 million, which is considered normal for the current U.S. population.


