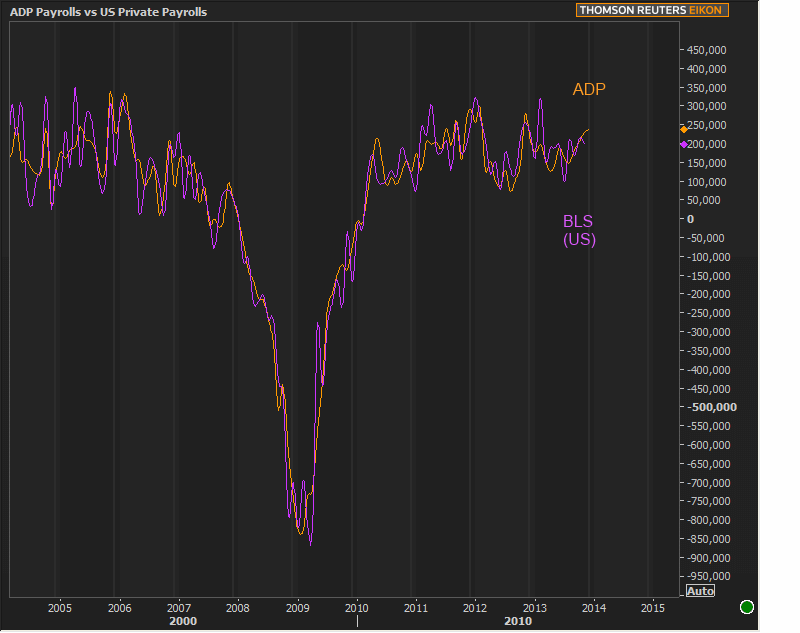
This analysis isn't intended to extoll the virtues of ADP, but it's going to seem that way based on the objective facts offered. It's also meant to stand as a reference piece to build on for future discussions, so this will be less about "the day ahead" and more about NFP vs ADP.
The interplay between the ADP Employment numbers and the official private payroll figures from the Bureau of Labor Statistics (BLS) is a recurring source of conversation, debate, and conjecture. ADP numbers tend to be scorned more than praised--especially prior to the methodology change at the end of 2012. Interestingly enough, that's more to do with timing than reality.
I think the main reason that ADP has had such a woefully bad rap at times has to do with the utter ferocity of that with which we compare it, namely: NFP (or more appropriately, the Private Payrolls component of NFP, because NFP itself is actually a rather poor long-term yardstick for job creation due to fluctuation in government hiring, especially on Census years).
By "ferocity," I mean that no one argues with BLS payrolls. If they beat big, bonds sell, and if they miss big, bonds rally. End of story. In short, they have the final say when it comes to employment data week. If ADP happens to disagree, ADP must therefore be wrong and bad and stupid and a downright lousy predictor. History is written by the victor, and BLS is always victorious in this fight. But that doesn't mean the victor's own account of his exploits won't look a bit silly in hindsight.
What's silly is how much the BLS Payrolls end up fluctuating compared to a relatively more staid ADP series. See this phenomenon at work in the chart below. BLS is in the magnificently resplendent dark orchid hue (let's say "purple" for the sake of simplicity) while ADP is in the much less flashy Orange/Dark-Orange. If you didn't know which was which, you might conclude the orange line knows where it's going and the purple line struggles to keep close.
Would that really be that hard to believe? On the one hand, we have the BLS--a government office that has the word "bureau" right in its name. It calls people on the telephone to ask if they're working (among other things...) in order to generate the unemployment rate that's a key ingredient in the monetary policy that dictates more financial market movement than anything else on the planet. It's on a family tree with 21 siblings and 8 aunts and uncles inside the Department of Labor. Seriously:
ADP on the other hand is the largest payroll processor ever, and has competed in the free market to earn the business of a vast majority of Fortune 500 companies. It processes payroll for more businesses than BLS even manages to survey. To maintain its dominance in the free market, it relies on technology and innovation. Whereas BLS is calling 72,000 land-line phone numbers per month, ADP can simply push a button and see how many new payrolls it's processing.
So no... it's not at all hard to believe that ADP could be the more even-keeled of the two private payroll siblings. The fact is that ADP could unquestionably deliver more accurate and more timely statistics on the state of payroll growth in the United States. But that's not the purpose of their report.
Take a look at their methodology, and they'll be happy to tell you they realize that BLS's numbers are the holy grail of financial markets and ADP is in a position to try to estimate those better than than anyone. The only reason ADP has revisions is because of this effort to get inside BLS's head. They jump through lots of hoops to force their modern processes to result in the same sorts of numbers as the BLS. (Seriously, if you're interested in this stuff, spend some time with that link on the methodology).
But even when we look at the revisions, we find ADP staying much closer to home than BLS. The chart below shows the INITIAL print for each set of data in the solid lines and the first revision in dotted lines. ADP is in red, BLS in blue. As you can see, things are pretty even, but on average, BLS revisions are more volatile. in 2013, the 4-month moving average topped out around 20k for BLS compared to only 10k for ADP. Additionally, ADP's only substantial revision was for October's data, when the Government shutdown happened. BLS's 'big woops' was in April when there was much less of an excuse.
All that having been said, and back to ADP's own point in their methodology, BLS rules the roost. It's Friday's NFP data that is the most epic market mover, while Wednesday's ADP is only a competent opening act. NFP disagrees with ADP frequently, but the larger revisions typically bring it back in such a way that ADP indeed remains more even-keeled. If it looks like ADP's revisions are always moving the the direction of the BLS numbers, they are, and that's by design.
So what can Wednesday's ADP tell us about today's BLS numbers? Sadly, the average miss for NFP in January is over 70k and the average beat is over 50k, so anything can happen. ADP is far more capable of telling us that moving average of BLS private payrolls 2nd revisions will probably end up passing through 238k in a few months. BLS, on the other hand, can tell us where interest rates will be heading.
| MBS |
FNMA 3.0
94-28 : +0-00
|
FNMA 3.5
99-09 : +0-00
|
FNMA 4.0
102-30 : +0-00
|
| Treasuries |
2 YR
0.4259 : -0.0031
|
10 YR
2.9691 : +0.0041
|
30 YR
3.8831 : +0.0101
|
| Pricing as of 1/10/14 6:36AMEST | |||
|
Tomorrow's Economic Calendar
|
||||||||||||||||||||||||||||||||||||||||||||||
|
||||||||||||||||||||||||||||||||||||||||||||||


