There are two kinds of market watchers in the world: those who believe the Fed plays the largest role in setting the pace of big movement in bond markets, and those who don't know any better. Anyone can pontificate about the "Fed losing control" of interest rates, but no one can deny that they're far more in control of big moves than anything else by a wide margin.
It seems fashionable to say that the Fed has been "unclear in their policy transmission" and that markets have suffered from the uncertainty, but they've been pretty clear, and this sell-off has been pretty tame compared to the two most comparable sell-off's in modern economic history.
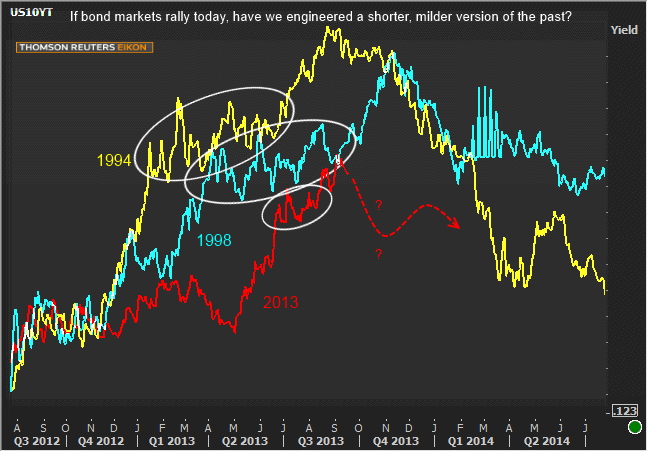
In fact, if you consider the dip in the red line in the chart below (March 2013) as an unfortunate confluence of circumstances that rope-a-doped markets into position for a sucker punch, everything since June 19th has been fairly even-keeled by historical comparison. March 2013 was when Cyprus was flaring up, and early April was the absolutely awful initial print of the jobs report.
These events sort of "tricked" markets into looking the other direction after Bernanke laid out the framework for tapering at his March 20th press conference. It just felt too soon to consider such things "back then." Fast forward one month and bonds were ready to keep rallying if Jobs were weak again. They weren't. The rest is history (2 huge upward revisions and a strong print on May 3rd followed by the inception of "the sell-off"). If it's of any consolation, this sell-off (in red below) hasn't been on pace with the last two similar examples.

But perhaps the reason it hasn't been on pace with the previous two examples is that it's not designed to be. After all, the Fed was in perfect control of the information that was put out in late May and mid June. Both of these afforded opportunities to push back firmly against the notion of tapering, but if anything, we got the opposite, not to mention the official shift in the June FOMC Announcement.
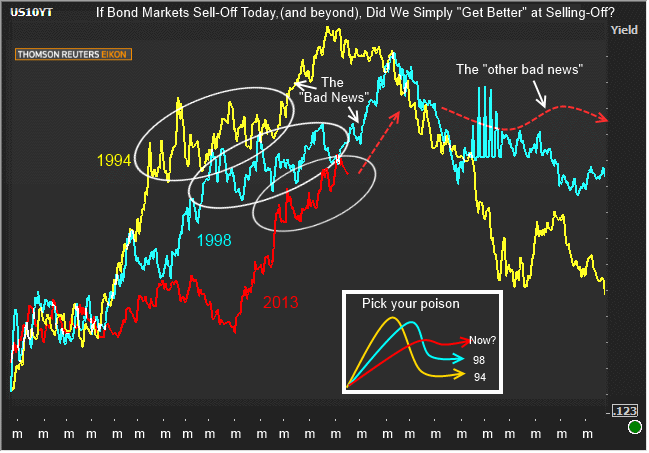
So the question is, have markets--courtesy of the Fed--simply gotten better at managing big, nasty sell-offs? Take a look at the 1994 line above or below. We certainly don't want that sort of volatility (much sharper rise, much sooner after a long-term low, and much more abrupt retracement). The teal line marking 1998 is an improvement in all regards.
The initial spike in rates 3-4 months after the long term low was HALF what it was in 1998, and though the selling commenced again a few months later, it didn't get as high or as volatile the second time around. It spent much more time getting to where it was going and it didn't abruptly fall back to earth.
Unfortunately, this "evolution" of selling-off raises the possibility that the current goal is to further prolong the selling, further decrease the magnitude of the overall move, but in so doing, further raise the floor on the way out. That means we could be looking at 3% as a floor in 2014.
NOTE: both charts use fixed 2yr ranges on the x-axis and fixed 3 point ranges on the Y-axis. Both of them begin with the long term low yields. Dotted lines are hypothetical.

Of course, these musings are simply based on charts. We've heard the argument--and it feels compelling for now--that the economic headwinds created by this rise in rates will take a sufficient toll to help the rate outlook moderate. The reasons that argument is compelling may be fresh in the mind of the Fed as they wrap up their second day of meetings today, and now may be the time where they choose to instill the next "moderation of pace" in the selling-trend--maybe one sufficient to let markets get caught up to these new interest rate realities.
|
Week Of Tue, Sep 16 2013 - Fri, Sep 20 2013 |
|||||
|
Time |
Event |
Period |
Unit |
Forecast |
Prior |
|
Mon, Sep 16 |
|||||
|
08:30 |
NY Fed manufacturing |
Sep |
-- |
9.10 |
8.24 |
|
09:15 |
Capacity utilization mm |
Aug |
% |
77.8 |
77.6 |
|
09:15 |
Industrial output mm |
Aug |
% |
0.3 |
0.0 |
|
Tue, Sep 17 |
|||||
|
08:30 |
Annual Core CPI |
Aug |
% |
1.8 |
1.7 |
|
08:30 |
Consumer Price Index (CPI) |
Aug |
% |
0.2 |
0.2 |
|
08:30 |
Core CPI |
Aug |
% |
0.2 |
0.2 |
|
10:00 |
NAHB housing market indx |
Sep |
-- |
60 |
59 |
|
Wed, Sep 18 |
|||||
|
07:00 |
MBA Mortgage market index |
w/e |
-- |
-- |
385.0 |
|
08:30 |
Housing starts number mm |
Aug |
ml |
0.913 |
0.896 |
|
08:30 |
Building permits: number |
Aug |
ml |
0.950 |
0.954 |
|
14:00 |
FOMC Announcement |
N/A |
% |
-- |
-- |
|
14:00 |
FOMC Economic Projections |
N/A |
-- |
-- |
-- |
|
14:30 |
FOMC Chair Press Conference |
N/A |
-- |
-- |
-- |
|
Thu, Sep 19 |
|||||
|
08:30 |
Current account |
Q2 |
bl |
-96.8 |
-106.1 |
|
08:30 |
Initial Jobless Claims |
w/e |
k |
330 |
292 |
|
10:00 |
Existing home sales |
Aug |
ml |
5.34 |
5.39 |
|
10:00 |
Philly Fed Business Index |
Sep |
-- |
10.1 |
9.3 |
|
10:00 |
Leading index chg mm |
Aug |
% |
0.4 |
0.6 |
|
13:00 |
10yr TIPS Auction |
-- |
bl |
13.0 |
-- |
|
|
|||||


