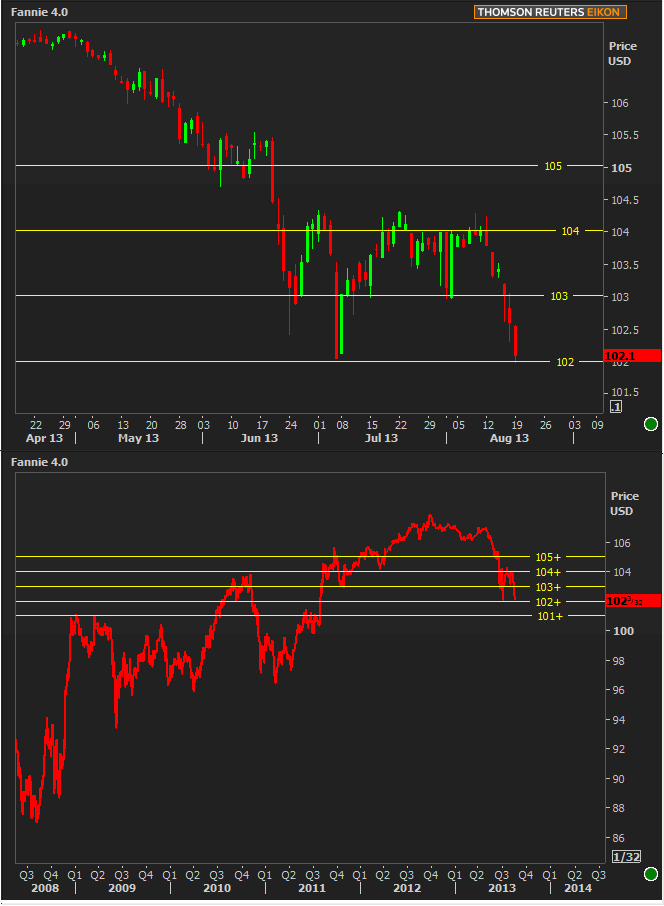
At least tomorrow morning there will be something substantive coming up during the course of the day to discuss with anticipation. Until then, we're left to see whether or not bond market participants--in their decreased summertime numbers--will feel like yesterday's weakness was finally enough to stick out a brave hand for the falling knife of prices. The other option would be to wait for tomorrow's FOMC Minutes before reaching for the knife more confidently. There are few technical considerations that may embolden those who wish to stand their ground against the illiquid tide of negative momentum, not the least of which being the revisit to 102 in Fannie 4.0 MBS. That said, it's not the most meaningful long term inflection point for that particular coupon (note the lower chart and the bigger pivot around 101 when zoomed out).

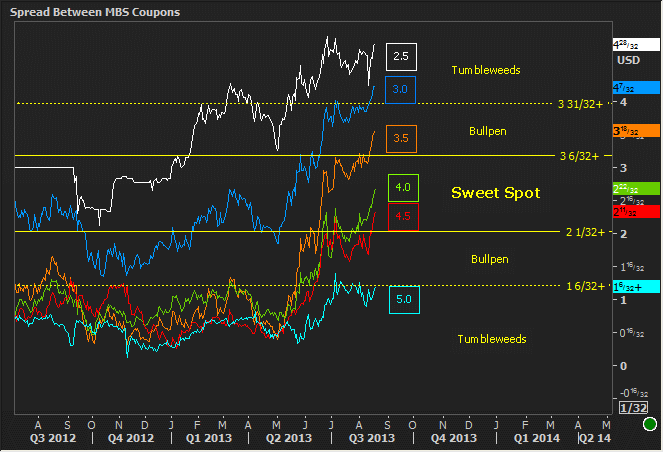
This 101-105 price range is significant for another reason as well. It's coincided with the slow changing of the guard where 3.5 coupon originations have become more and more scarce. While it's still too soon to call it complete--and taking things with a grain of salt due to light staffing--yesterday's sell-off finally bumped 3.5s out of the sweet spot and gave 4.5s much more of the spotlight that they'd already been seeking. The following chart is an update of a previous chart with the difference in price between the coupon in question and the next highest coupon. The sweet spot for healthy liquidity is roughly a 2 to 3 point gap. As 3.5s head up toward a 4 point gap from 4.0s, they're essentially being put out to pasture. NOTE: no sooner are they leaving than 4.5s are happy to step in (just like 3.5s and 4.0s stepped in when 3.0s went out to pasture in late June).

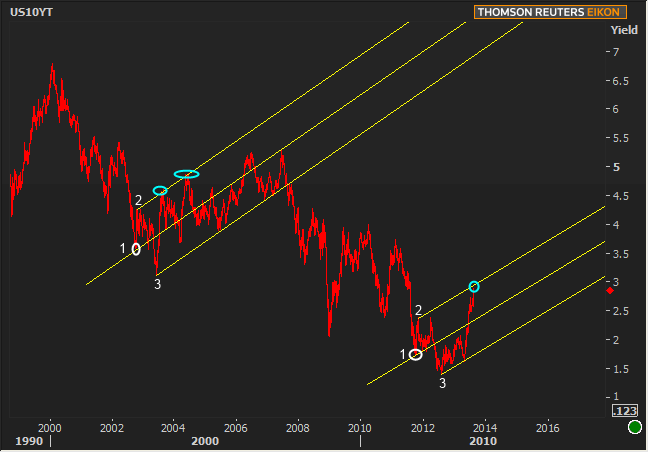
On a final note (and because on days where there are no significant items on the calendar, it's fun to play with charts), here's a fractal repetition of an Andrew's Pitchfork now compared to 10yrs ago for those of you who'd like to keep a positive outlook even if there are 27 other charts showing the longer term rising rate environment. The pitchfork is pretty simple. The first point is a significant level of your choosing, either because it was a long term high/low or important inflection point. this is the starting point of the pitchfork with points 2 and 3 being the firs major high and low. In this case, "point 1" was a long term low for 10yr yields in both cases that saw an extended sideways grind limited on the upside by "point 2" in both cases and eventually making a new low at "point 3." In 2003, the upper prong of the pitchfork offered support defending against a steeper sell-off. If 10's can manage to cool their jets this week, a similar possibility for a long grind toward higher yields will be in play.

|
Week Of Mon, Aug 20 2013 - Fri, Aug 24 2013 |
|||||
|
Time |
Event |
Period |
Unit |
Forecast |
Prior |
|
Tue, Aug 20 |
|||||
|
08:30 |
National Activity Index |
Jul |
-- |
-- |
-0.13 |
|
Wed, Aug 21 |
|||||
|
07:00 |
Mortgage market index |
w/e |
-- |
-- |
471.9 |
|
07:00 |
MBA 30-yr mortgage rate |
w/e |
% |
-- |
4.56 |
|
10:00 |
Existing home sales |
Jul |
ml |
5.16 |
5.08 |
|
14:00 |
FOMC Minutes (Jul 31st Meeting) |
-- |
-- |
-- |
-- |
|
Thu, Aug 22 |
|||||
|
08:30 |
Initial Jobless Claims |
w/e |
k |
330 |
320 |
|
09:00 |
Monthly Home Price yy |
Jun |
% |
-- |
7.3 |
|
09:00 |
Monthly Home Price mm |
Jun |
% |
-- |
0.7 |
|
13:00 |
5yr Treasury Auction |
-- |
bl |
16.0 |
-- |
|
Fri, Aug 23 |
|||||
|
10:00 |
New home sales chg mm |
Jul |
% |
-- |
8.3 |
|
10:00 |
New home sales-units mm |
Jul |
ml |
0.485 |
0.497 |
|
* mm: monthly | yy: annual | qq: quarterly | "w/e" in "period" column indicates a weekly report * Q1: First Quarter | Adv: Advance Release | Pre: Preliminary Release | Fin: Final Release * (n)SA: (non) Seasonally Adjusted * PMI: "Purchasing Managers Index" |
|||||


