The Federal Reserve Bank of New York has taken on a laudable and possibly herculean task - trying to make its policies and operations understandable to everyday Americans. Last week we summarized its attempt to put the recent bond sell-off in historical perspective. Now it has initiated a series of articles explaining the origin, rationale and performance of the System Open Market Account (SOMA), a portfolio held by the Federal Reserve (Fed) to support monetary policy implementation. The first installment deals with the history of SOMA and how the composition of its portfolio has evolved over time.
The authors of the article, Meryam Bukhari, Alyssa Cambron, Michael Fleming, Jonathan McCarthy, and Julie Remache said their research and entry are appropriate because SOMA has attracted greater attention in recent years because the Fed is constrained by the fact the federal funds rate cannot go lower than zero. Thus it has turned to SOMA where the size and composition of the domestic portfolio could be used as an active monetary policy instrument. Earnings on the SOMA portfolio represent a significant amount of the Fed's income and, given the substantial increase in the size of the portfolio and shift in its composition, income has increased notably, with remittances to the Treasury totaling $88.4 billion in 2012.
The Federal Reserve Act specifies the assets that a Federal Reserve Bank can buy or sell on the open market and the list is generally limited to obligations issued by or fully guaranteed by the U.S., a U.S. agency or a foreign government and some certain local government obligations. Thus the SOMA domestic portfolio has traditionally been composed of Treasury certificates, bills, notes, and bonds. Prior to 1975 SOMA also held banker's acceptances which are obligations of banks against future payments.
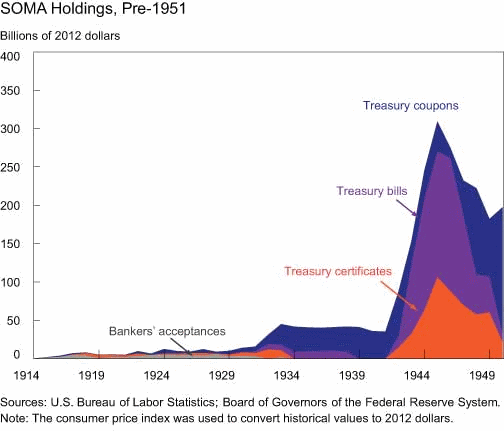
The Fed was founded in 1913 and in the early years its SOMA portfolio was small, the equivalent of $1.8 billion in 1915 (all figures are in 2012 dollars), and used primarily to generate income to operate the bank. Early holdings were banker's acceptances and some Treasury securities. By 1925, however, the Fed began to use open market operations as a counter-cyclical policy tool to affect credit availability. Open market operations were used more frequently as the Great Depression began and the growing portfolio shifted toward Treasury coupon securities (notes and bonds.)

During WWII, the
portfolio, fueled by wartime debt, grew from $40 billion to more than
$300 billion, most of it in Treasury bills and certificates. The
Open Market Desk at the Federal Reserve Bank of New York purchased
Treasury securities and set rates on Treasury auctions to maintain
favorable borrowing conditions for the government during the war and
the immediate postwar years. Finally however increased pressures on
longer-term rates led the Fed to purchase more longer-term
securities, shifting the portfolio from T-bills to coupon securities.
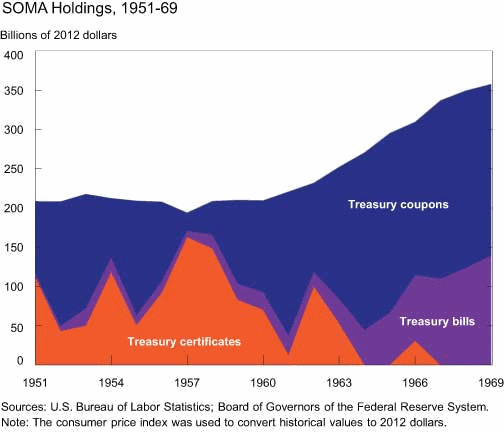
In 1952 Treasury and the Fed signed the
Treasury-Federal Reserve Accord which gave the Fed the exclusive
ability to set monetary policy without influence from Treasury. For
the next decade the Fed shifted its approach to managing the level of
bank reserves to affect the availability of credit through commercial
banks and the size of SOMA remained fairly steady although the
composition shifted back toward short-term, liquid instruments.

The original "Operation Twist" for which the recent version was nicknamed began in the early 1960's as the Fed attempted to lower long-term interest rates in order to foster capital investment and economic growth without without affecting short-term rates and exacerbating the existing flow of gold outside the U.S, The SOMA Desk sold $69 billion of short-term Treasury certificates (30 percent of the 1961 portfolio) and purchased an equivalent amount of longer-term Treasury coupons.
Beginning in the 1970s and lasting until 2007 the portfolio was used to reach whatever target the Fed might have, usually the fed funds rate but also, in the late 1970s and early 1980s the growth rates of monetary aggregates. Over these 30+ years the portfolio expanded at about the same rate as the currency in circulation and its composition was generally split between T-bills and coupons with an emphasis on short term holdings and liquidity. The weighted average maturity (WAM) over this period was 3.7 years and T-bills varied between one-third and one-half of the total

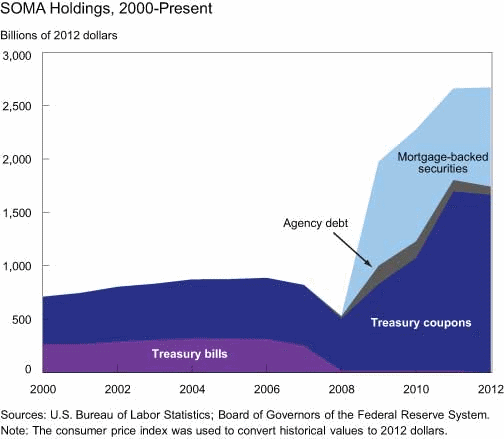
Then the financial crisis hit. At first the Fed reacted to provide liquidity through the Term Auction Facility and central bank liquidity swaps, often through reductions in SOMA securities holdings in order to maintain the size of the balance sheet and a steady level of bank reserves. The SOMA portfolio had fallen by a third by the end of 2008, to $500 billion and the WAM increased to 6.8 years because the size reduction came primarily from short term holdings.
By that time the fed funds was lowered to the zero lower bound and the normal policy tool of reducing short term rates no longer existed so the Fed began to rely more on the SOMA portfolio as a direct tool of monetary policy. It purchased longer term assets to reduce private sector holdings and reduce both term premia and long-term rates. FOMC made large-scale purchases of Treasury, agency debt, and agency mortgage-backed securities (MBS) and increased the portfolio to 2.7 trillion by the end of 2012 - more than triple its size before the crisis began and well in excess of the currency in circulation.

The crisis changed the composition of
the portfolio greatly both because of the addition of the MBS and
agency debt securities and because the Treasury portfolio also
shifted further to longer-term securities because of the introduction
of the Treasury Maturity Extension Program. By the end of 2012 the
WAM was at 10.4 years. The authors say that further purchases under
the current asset purchase programs will increase the size of the
SOMA portfolio and maintain the composition toward longer-term
assets.
In subsequent articles the authors say they will show
how income from SOMA has varied over time and how this has been
affected by interest rates. They will also present a counter-factual
example to illustrate how the portfolio might have evolved had the
FOMC not used the Fed's balance sheet to pursue its statutory dual
mandate in the face of the recent financial crisis and the ongoing,
slow economic recovery.


