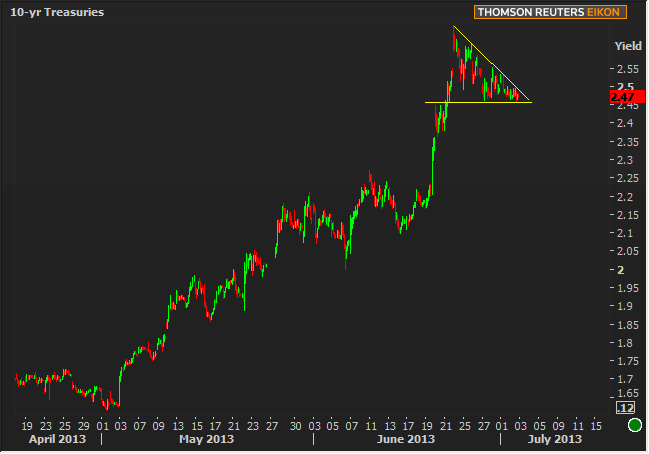
Yesterday's commentary noted that bond markets were likely to be 'bowling with the bumpers' for one more day--or at least held it out as a possibility. Markets did not disappoint as MBS traded an "inside" day (all Tuesday's price movements occurred "inside" Monday's range) and Treasuries continued to consolidate. Here's an updated version of the 10yr chart. I have it good authority from a bowler and cornerstone MBS Live member (thanks Ira) that the chart, in fact, is less reminiscent of bumper bowling and looks much more like an old 'MBS dragon' chart. Granted, this isn't MBS, but it's certainly draconic, even without extra adornment:

Seeing a dragon on a bowling alley could either be "cool" or "scary." Today's trading possibilities are similar in that one of the two lines (and maybe both) will probably break even before Friday's NFP. This is more common than not. Such "triangles" rarely contain all of the charted security right through to the anticipated event that usually coincides with their apex. In plain English, the two lines come together on the same hour that NFP occurs on Friday, but the fairly robust batch of data today is more likely to cause a break to either side. That break may garner a bit of extra momentum for several reasons (the data itself could be relatively significant, thin liquidity could make levels easier to push around, technical "stops" could cause some snowball buying/selling), but we still won't know which way the triangle is attempting to break until NFP.
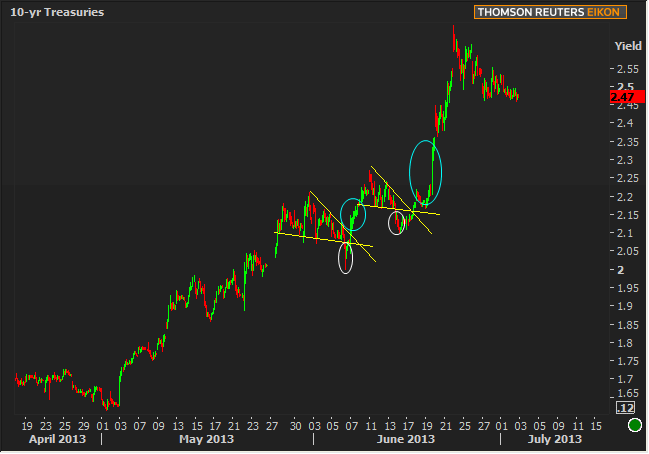
That might seem odd to consider based solely on the description, so let's take a look at the phenomenon on a chart. Fortunately, the same one we just used above contains two recent examples of triangle breaks that ultimately resolved in the other direction. In both cases, note the initial break to the downside in the white circles followed by a reversal and strong confirmation to the upside in the teal circles.

The point of examining those recent examples is not to scare you by suggesting that yields will break higher again in the same way, and neither is it to suggest that Today's likely breakout will be reversed on Friday. It's simply a reminder that we can't draw any strong conclusions until we have a strong statement about the consolidating trends. It could be the case that yields break lower and hit 2.0 before ever returning to 2.47. It could also happen that we break higher and hit 3.0 in the coming months before ever returning to 2.47. It all depends on the data, and while this week's data isn't enough to get us to 2.0 or 3.0 in and of itself, it's one of the major milestones in that process (simply by virtue of containing an Employment Situation Report).
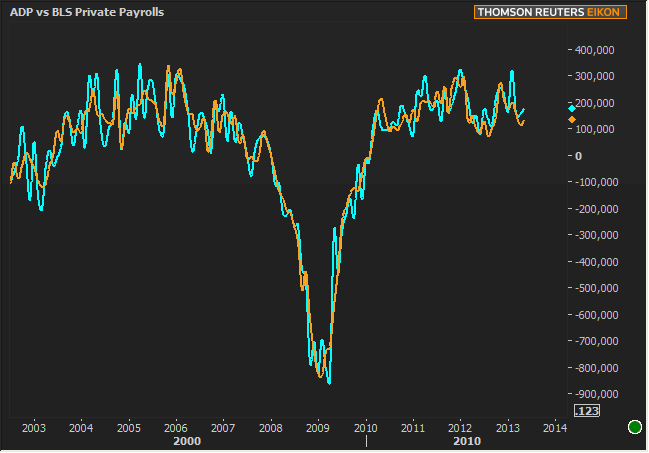
Of course Friday is the biggie, but today is no slouch. ADP's private payrolls data is unquestionably well-correlated with the private payrolls component of BLS's Employment Situation over time, even before ADP revised their methodology. Of course there are notable examples of BIG miscues, but if you had to vote yay or nay on "ADP agreeing with BLS on the acceleration or deceleration in payrolls," there's only one option.

Looking at that chart (ADP is the orange one by the way... actually looking much less noisy than the government data), it's easy to see why this report has caused some of the big pops historically. If there's any reason markets haven't treated this like a secret NFP preview, it's been the presence of those notable "big miscues," and to a lesser extent, the changing landscape of government vs private payrolls (where private payrolls increasingly accounts for the majority of the NFP print). Additionally, it's been more likely to accurately predict the direction of BLS's private payroll growth or deceleration since the methodology revision in late 2012. Bottom line: if it deviates appreciably from the 160k consensus, a big 'lead off' in bond markets is a fair expectation ahead of NFP.
The story is far from over after the 8:15am payrolls data, however. There are several other reports of note, some of them 'visiting' after having been displaced by Thursday's holiday. Chief among those is the weekly Jobless Claims data. In and of itself, this isn't a biggie, but every little bit of employment data is important when markets are eager to confirm or reject current Fed tapering assumptions (which are largely seen to be dependent on employment data). Too, there's ISM Non-Manufacturing data which is far from insignificant and also contains an employment sub-index. Along with the ancillary data (International Trade, Challenger Job cuts, and perhaps even MBA applications considering the potential importance of the housing market in Fed policy), we have quite a lot to digest for a mere half day (markets close early) before a holiday with NFP on the other side. We're not sure what to expect... not sure anyone else is either... and not sure the potentially bumpy ride will matter until after Friday's NFP at best.
|
Week Of Mon, Jul 1 2013 - Fri, Jul 5 2013 |
|||||
|
Time |
Event |
Period |
Unit |
Forecast |
Prior |
|
Mon, Jul 1 |
|||||
|
08:58 |
Markit Manufacturing PMI |
Jun |
-- |
-- |
52.2 |
|
10:00 |
Construction spending |
May |
% |
0.7 |
0.4 |
|
10:00 |
ISM Manufacturing PMI |
Jun |
-- |
50.5 |
49.0 |
|
Tue, Jul 2 |
|||||
|
10:00 |
Factory orders mm |
May |
% |
2.0 |
1.0 |
|
Wed, Jul 3 |
|||||
|
07:00 |
MBA Mortgage market index |
w/e |
-- |
-- |
629.2 |
|
07:30 |
Challenger layoffs |
Jun |
k |
-- |
36.398 |
|
08:15 |
ADP National Employment |
Jun |
k |
153 |
135 |
|
08:30 |
Initial Jobless Claims |
w/e |
k |
345 |
346 |
|
08:30 |
International trade mm $ |
May |
bl |
-40.0 |
-40.3 |
|
10:00 |
ISM N-Mfg PMI |
Jun |
-- |
54.0 |
53.7 |
|
Thu, Jul 4 |
|||||
|
-- |
Markets Closed for Independence Day |
-- |
-- |
-- |
-- |
|
Fri, Jul 5 |
|||||
|
08:30 |
Non-farm payrolls |
Jun |
k |
167 |
175 |
|
08:30 |
Unemployment rate mm |
Jun |
% |
7.5 |
7.6 |
|
08:30 |
Private Payrolls |
Jun |
k |
180 |
178 |
|
08:30 |
Average workweek hrs |
Jun |
hr |
34.5 |
34.5 |
|
08:30 |
Average earnings mm |
Jun |
% |
0.2 |
0.0 |
|
* mm: monthly | yy: annual | qq: quarterly | "w/e" in "period" column indicates a weekly report * Q1: First Quarter | Adv: Advance Release | Pre: Preliminary Release | Fin: Final Release * (n)SA: (non) Seasonally Adjusted * PMI: "Purchasing Managers Index" |
|||||


