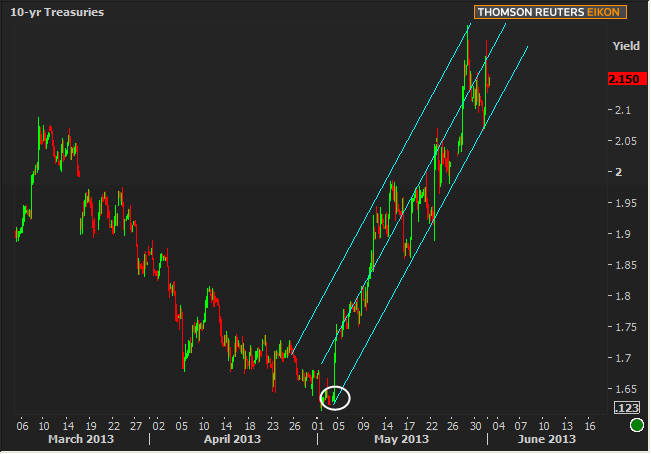
It's not the shortest week of the year, but it might as well be. By far and away, the most significant event will occur on Friday with Non-Farm Payrolls at 8:30am (though Wednesday's ADP Payrolls can spook the NFP horse on occasion). As we've seen so recently and so frequently, a singular instance of NFP can speak louder than several week's worth of mostly contradictory data. Although it wasn't the only factor in play in the uptrend seen in the chart of 10yr yields below, consider how stark a turning point the most recent report turned out to be.

In the chart above, notice how yields began to level off before May10th when the 'taper talk' accelerated. There was another attempt to consolidate sideways under 2.0% before Bernanke and the Fed Minutes prompted another break. But let's consider the remainder of the uptrend in a broader context.

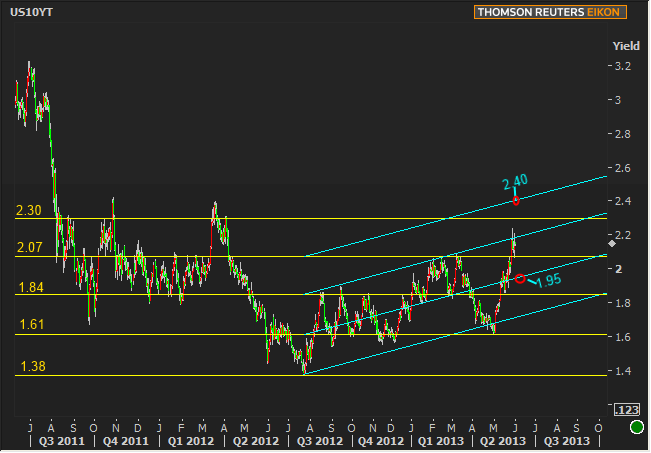
Note the 2nd teal as well as the 2nd yellow line from the top. The last week of May broke above both of these lines where neither had been broken in almost exactly one year. Whereas there was a concerted effort to maintain the 2.07 ceiling following Bernanke and the Fed, the most recent week seemed like it was straining to move into weaker territory.
The last time we saw such a thing, the roles were perfectly reversed with 10's doing their best to offer 1.68+ resistance against a rally that ultimately strained to get down to 1.61+ in the last week of the month. The common elements in both cases were twofold: about a month of almost unanimous momentum and an upcoming NFP. Could it be that we're now seeing a bearish version of the previous bullish lead-off that came up so frequently at the end of April?
If that's the case, then it's possible we leak even higher in yield before NFP itself (the 2.30 line would be the evil twin of the 1.61 line last month), with a negative NFP likely resulting in a return to the 2nd teal trendline.
But what if NFP is strong again? The latticework of trendlines in the chart above is helpful in hypothesizing about such things. Note that yields have generally jigged and ratcheted sideways, lower, and higher in ranges of roughly 0.23%, with the prevailing trend typically focused in a .56% range (mid 2011 - mid 2012: almost all 1.84-2.30). Late 2012 was all 1.38-1.84 and until last week, 2013 had been all 1.61-2.07.
Even if we bump the yellow horizontal lines and point them upward after hitting mid 2012 lows, yields still hold a broader range of .56%. In addition to the absolute high yields since mid 2011, this gives us another way to arrive at a near term maximum support ceiling at 2.40 (which is where the upper teal line passes on Friday). On a brighter note, that same logic would also allow for resistance as low as 1.95%.
Just considering 1.95-2.40% on paper seems like a big range, but look at the past 3 months of movement n the chart. Another 0.23% swing would be an easy thing to manage on almost any NFP week, but especially this one.
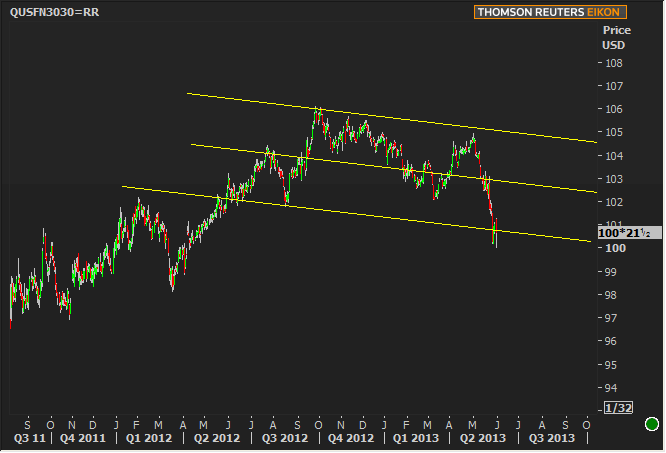
(obligatory MBS Chart because it's MBS Commentary after all.)

|
Week Of Mon, Jun 3 2013 - Fri, Jun 7 2013 |
|||||
|
Time |
Event |
Period |
Unit |
Forecast |
Prior |
|
Mon, Jun 3 |
|||||
|
08:58 |
Markit Manufacturing PMI |
May |
-- |
-- |
51.9 |
|
10:00 |
Construction spending |
Apr |
% |
1.0 |
-1.7 |
|
10:00 |
ISM Manufacturing |
May |
-- |
50.5 |
50.7 |
|
Tue, Jun 4 |
|||||
|
08:30 |
International Trade |
Apr |
bl |
-41.0 |
-38.8 |
|
Wed, Jun 5 |
|||||
|
07:00 |
MBA Mortgage market index |
w/e |
-- |
-- |
721.4 |
|
08:15 |
ADP National Employment |
May |
k |
160 |
119 |
|
08:30 |
Productivity Revised |
Q1 |
% |
0.7 |
0.7 |
|
08:30 |
Labor costs Revised |
Q1 |
% |
0.5 |
0.5 |
|
10:00 |
ISM N-Mfg PMI |
May |
-- |
53.3 |
53.1 |
|
10:00 |
ISM N-Mfg Bus Act |
May |
-- |
55.0 |
55.0 |
|
10:00 |
Factory orders mm |
Apr |
% |
1.5 |
-4.9 |
|
Thu, Jun 6 |
|||||
|
08:30 |
Initial Jobless Claims |
w/e |
k |
345 |
354 |
|
Fri, Jun 7 |
|||||
|
08:30 |
Non-Farm Payrolls |
May |
k |
160 |
165 |
|
08:30 |
Unemployment rate mm |
May |
% |
7.5 |
7.5 |
|
08:30 |
Average workweek hrs |
May |
hr |
34.5 |
34.4 |
|
08:30 |
Average earnings mm |
May |
% |
0.2 |
0.2 |
|
15:00 |
Consumer credit |
Apr |
bl |
12.50 |
7.97 |
|
* mm: monthly | yy: annual | qq: quarterly | "w/e" in "period" column indicates a weekly report * Q1: First Quarter | Adv: Advance Release | Pre: Preliminary Release | Fin: Final Release * (n)SA: (non) Seasonally Adjusted * PMI: "Purchasing Managers Index" |
|||||


