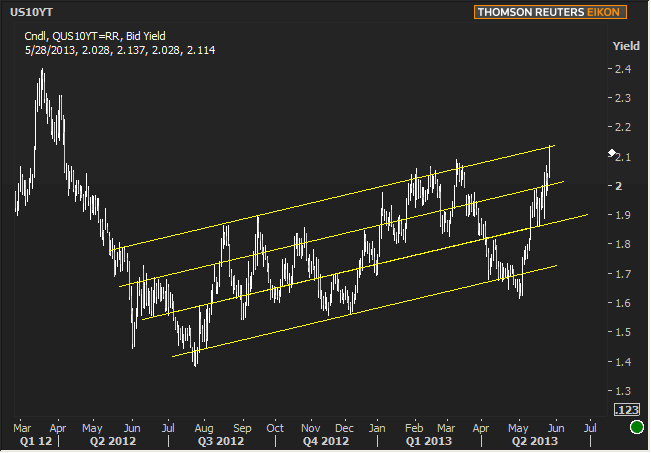
In this morning's "week ahead" post, we highlighted the previous support seen around 2.04-2.07 percent in 10yr yields and that longer-run economic fundamentals (i.e. where would we be without QE?) might logically suggest similar support could be seen again. But we cautioned: "Keep in mind that history hasn't been kind to this application of fundamental logic in the short term." The implication of that "unkindness" was a revisit to the outer limits of the long-term uptrend seen in the chart. It only took a few hours of trading for that to happen (chart below). Reprice alerts went out at 10:08 and 10:20am Eastern time on MBS Live, as the Dashboard lit up those familiar "red fireworks" which seem to be a new May tradition. Sellers dominated right from the outset as domestic accounts weren't a willing enough sponsor to get 10's back below the mid 2.03's from overnight (mid 2.03's were also MOSTLY a supportive ceiling last week, so bouncing on them as a floor this morning was ominous).
Selling was mostly contained under 2.06 for Treasuries until about 9:50am. By that time, the previous ground-holding was revealed to be merely short-covering. Buyers were nowhere to be found, and MBS convexity selling (lower coupons falling more quickly) was clearly adding to the snowball. Fannie 3.0s were over a point lower than Friday at their weakest levels, while Fannie 3.5's have been about 5-8 ticks better off depending on the time of morning (and they're now more than 3 points higher than 3.0s, solidifying them as the new current coupon for now). Stronger Consumer Confidence data merely added fuel to a fire that was already burning. Without it, we might only be off a bit more than half a point instead of hovering around a full point, but the negative bias in rates is clear. Here's what this morning's weakness has done for the long term trend in Treasuries:
(NOTE: the following 'pricing snapshot' is taken between 11:00 and 11:10am ET and the MBS MID-DAY commentary may be additionally delayed if markets are volatile in the morning.
MBS Live members get 100% live prices and real-time alerts/analysis)
MBS Pricing Snapshot
Pricing shown below is delayed, please note the timestamp at the bottom.
Real time pricing is available via MBS Live.
|
|
|
|
|
Pricing as of 11:09 AM EST
|
Morning Reprice Alerts and Updates
Below is a recap of instant
Reprice Alerts and updates issued via email and text alert to
MBS Live subscribers this morning.
10:20AM :
ALERT ISSUED:
An Alert So Short, You Know It's Serious
Melting Down Big Time! 10's over 2.10! Fannie 3.0s moving through lower 103-20s, almost a full point off on the day. Negative reprices are coming.
10:08AM :
ALERT ISSUED:
Confidence Turns up Heat on Melt-Down. Reprice Risk Already?
Negative reprice risk isn't out of the question as the lower end of the MBS stack is being brutalized by convexity selling. Fannie 3.0s are down 24 ticks at the moment (100-28) and any lender out with rates before the Confidence data who did not already account for such eventualities is already considering (or soon to be) repricing. 10's are instantly up to 2.0868 and stocks are soaring. No reason to expect a bounce until we can observe one in hindsight.
10:05AM :
ECON: Consumer Confidence Stronger Than Expected
- Headline 76.2 vs 71.0 consensus
- Present situation 66.7 vs 61.0 previous
- Confidence highest since Feb 2008
- Market Reaction: MBS to new lows, FN3.0s break below 101-00, currently 100-30.
The Conference Board Consumer Confidence Index®, which had improved in April, increased again in May. The Index now stands at 76.2 (1985=100), up from 69.0 in April. The Present Situation Index increased to 66.7 from 61.0. The Expectations Index improved to 82.4 from 74.3 last month.
The monthly Consumer Confidence Survey®, based on a probability-design random sample, is conducted for The Conference Board by Nielsen, a leading global provider of information and analytics around what consumers buy and watch. The cutoff date for the preliminary results was May 15.
Says Lynn Franco, Director of Economic Indicators at The Conference Board: “Consumer Confidence posted another gain this month and is now at a five-year high (Feb. 2008, Index 76.4). Consumers’ assessment of current business and labor-market conditions was more positive and they were considerably more upbeat about future economic and job prospects. Back-to-back monthly gains suggest that consumer confidence is on the mend and may be regaining the traction it lost due to the fiscal cliff, payroll-tax hike, and sequester.”
9:34AM :
MBS Hit New Lows; Treasuries Near High Yields
MBS are in the midst of a well-rehearsed melt-down routine where Treasuries are merely retesting morning weakness while Fannie 3.0s are almost 2 ticks into new lows for the day. None of the recent move is data-driven, but rather tradeflow-based in Treasuries with the negative convexity trade in MBS following suit. 10's have (so far!) bounced again before heading over 2.06, and MBS may reluctantly acquiesce to holding their ground as long as that continues to be the case, but there's absolutely no guarantee it will continue to be the case. If anything, short, intermediate, and long term trends are all aligned toward weakness at the moment and holding under 2.06 in 10's would be a pleasant surprise. The (new) equivalent price level in Fannie 3.0s is 101-06 at the moment.
9:15AM :
ECON: Case Shiller Home Prices Rise Most Since April 2006
- 20 City index +1.1 vs +1.0 forecast, seasonally adjusted
- Non seasonally adjusted +1.4 vs +0.7 forecast
- Largest year-over-year increase since April 2006
Data through March 2013, released today by S&P Dow Jones Indices for its
S&P/Case-Shiller1 Home Price Indices, the leading measure of U.S. home prices, showed that all three
composites posted double-digit annual increases. The 10-City and 20-City Composites increased by 10.3% and
10.9% in the year to March with the national composite rising by 10.2% in the last four quarters. All 20 cities
posted positive year-over-year growth.
In the first quarter of 2013, the national composite rose by 1.2%. On a monthly basis, the 10- and 20-City
Composites both posted increases of 1.4%. Charlotte, Los Angeles, Portland, Seattle and Tampa were the five
MSAs to record their largest month-over-month gains in over seven years.
8:57AM :
Bond Markets Attempting to Bounce After Weaker Open
Treasuries had a rough enough overnight session as it was, with Asian markets taking 10yr yields over 2.04, and European markets providing only a moderate correction. By 8am, 10's had only managed to get down into the mid 2.03's before domestic accounts unleashed hell at the 8:20am CBOT open.
Comments from ECB's Asmussen may have factored in the sell-off, as he suggested that the European Stability Mechanism could be used as a stop-gap resolution fund for Europe's banking system until an official resolution mechanism could be created, when the ECB takes over EU bank supervision (yes, that's really really confusing).
Less confusing is the effect that all of the above has had on MBS so far this morning. 3.0s were down 13 ticks at their worst to new 2013 lows of 101-07 and are currently down 10 ticks at 101-10. Treasuries are still elevated with 10's up 3.7bps at 2.0478. If there's one silver lining, it's that the 2.04-2.07 "supportive ceiling zone" held up in 10's.
S&Ps are up more than 13 points from last week's latest levels. The economic data coming up isn't likely to have much of an effect with S&P Case Shiller Home Prices at 9am. Consumer Confidence at 10am might have slightly more of an effect. Between now and then, we can hope to hold ground inside earlier weak points from around 8:45am.
Live Chat Featured Comments
Matthew Graham : "like this: http://screencast.com/t/jxCr3Zml"
Matthew Graham : "At this point, it looks like the "lead-off" in late April was the smoke and mirror section of this carnival ride and we're just getting back in line with the trend after the mirrors were broken on May 3rd."
Michael Gillani : "More smoke and mirrors......I don't see this as a long term deal. Just as quickly as rates have risen they can fall, ie April of this year. Equities are due for a major correction and traders are just enjoying the gold rush right now. There are sill way too many negatives for the economy as a whole and if the Fed trims back you'll see the eonomy fall back into tailspin even faster. Speedbumps."
Christopher Stevens : "REPRICE: 10:15 AM - Flagstar Worse"
Daniel Kramer : "nothing is ever gradual in this biz. i always expedcted higher rates, but a gradual rise over months, not a one week shot up of over a .50 point"
Jason Anker : "not a fun converation"
Ray Leone : "In the process of taking a lot of application been working on for the past 2-4 weeks. It's a whole different picture now. What to do?"
Ray Leone : "Can't really explain this to customers"
Matthew Graham : "RTRS - US MAY CONSUMER CONFIDENCE INDEX HIGHEST SINCE FEBRUARY 2008 "
Brent Borcherding : "Sure seemed that way, MG."
Matthew Graham : "RTRS- US CONSUMER EXPECTATIONS INDEX 82.4 IN MAY VS APRIL REVISED 74.3 (PREVIOUS 73.3) - CONFERENCE BOARD "
Matthew Graham : "RTRS- US CONSUMER PRESENT SITUATION INDEX IN MAY 66.7 VS APRIL REVISED 61.0 (PREVIOUS 60.4) "
Matthew Graham : "think someone got that a few minutes early? "
Jude Bridwell : "Good lord"
Matthew Graham : "RTRS- US MAY CONSUMER CONFIDENCE INDEX 76.2 (CONSENSUS 71.0) VS APRIL REVISED 69.0 (PREVIOUS 68.1) - CONFERENCE BOARD "
Steven Stone : "if rates go up one percent...I doubt there will be a lot of markets that can continue to gain"
Bryce Schetselaar : "That's true Sung...but pre-crisis we had a completely different mortgage market...stated income, option arms, etc"
David Gaffin : " GM all Between rising rates and rising home prices and appraisals that are coming in light, it may take a couple of months, but I think it will slow down in greater boston."
Sung Kim : "and when the press puts out headlines like Boom Is Back: Home Prices Jump Most in Seven Years ... it fuels the frenzy"
Sung Kim : "no, rates were much higher pre-crisis and homes sales were much higher"
Bryce Schetselaar : "do you think it does enough to make the housing recovery sputter?"
Ray J : "it certainly cuts their buying power"
Bryce Schetselaar : "It will be interesting to see how fast this 400 bps movement is going to affect home prices. My buyers are not too happy about the much higher rates...Does that keep them from buying? Make them more rational?"
Matthew Graham : "RTRS- MARCH 20-METRO AREA YEAR-ON-YEAR HOME PRICE INCREASE LARGEST SINCE APRIL 2006 "
Matthew Graham : "RTRS - US Q1 2013 HOME PRICES VS Q4 2012 +3.9 PCT SEASONALLY ADJ, +1.2 PCT NON-ADJUSTED - CASE SHILLER NATIONAL INDEX "
Matthew Graham : "RTRS- US MARCH 20-METRO AREA HOME PRICES NON-ADJUSTED +1.4 PCT (CONSENSUS +0.7) VS +0.3 PCT IN FEB-S&P/CASE-SHILLER "
Jason Sheaffer : "Maybe this is a new trend. It seemed like we started every morning green & then turned red around 10. Maybe it will go the other way today "
Matthew Graham : "RTRS- US MARCH HOME PRICES IN 20 METRO AREAS +1.1 PCT SEASONALLY ADJ (CONSENSUS +1.0) VS REVISED +1.3 IN FEBRUARY- S&P/CASE-SHILLER "
Sung Kim : "every morning I wake up to see down 12 ticks"
Sung Kim : "may 3"
B-C : "2 weeks ago"
Ray J : "yeah, at what point does panic set it?"
Jason Anker : "this is gettign silly"
John Tassios : "Excellent charts MG, that pretty much sums it up in in your article this morning "


