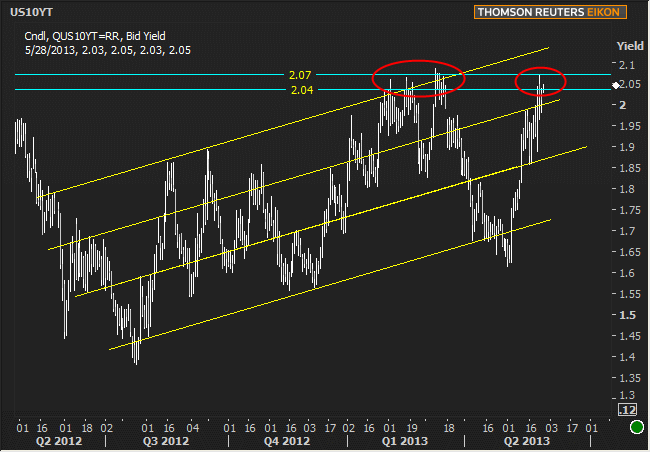
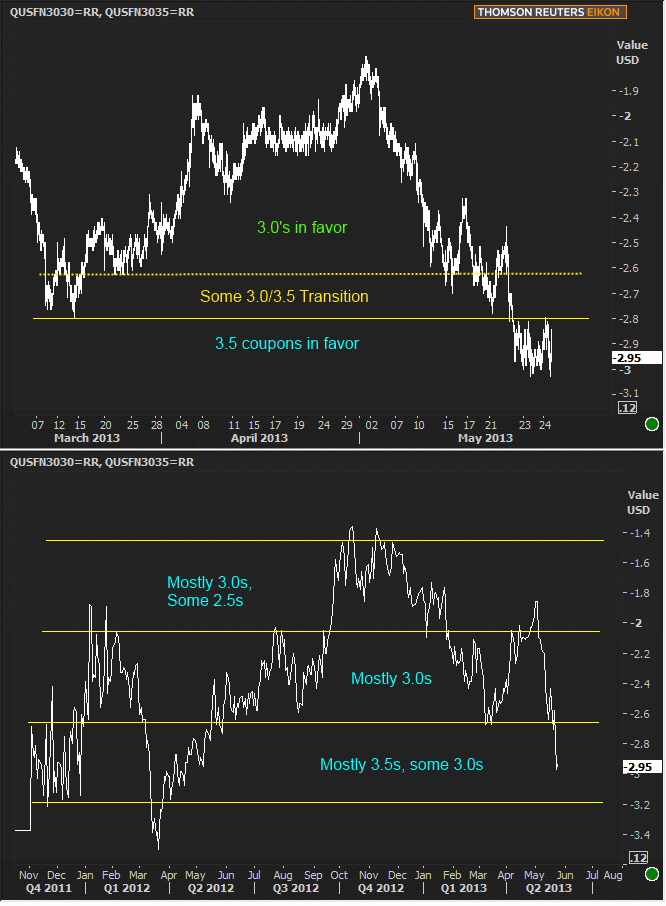
The past 4 weeks of selling brings MBS and Treasuries back to the scene of old battlegrounds from sell-offs past. With a moderate week of economic data, a round of Treasury auctions, and 'month-end' on Friday, we have the opportunity to either relive the past victories at defensive walls or inch further into negative territory. Either eventuality could be limited by the fact that the following week brings the Employment Situation Report, and will probably do more to determine whether or not long term charts look more like ground-holding or ground-breaking at the end of May.
Treasuries embody the "better" part of familiar old battlegrounds in the sense that previously supportive ceilings between 2.04 and 2.07 are fairly clearcut. Here's a longer-term chart with the uptrend shown as normal. A case can also be made for the uptrend simply running into those ceilings above 2.0%. Such ceilings make all kinds of sense if you believe A) the economy isn't fixed, B) the global economy is still a risk/drag, C) the Fed won't be able to taper quickly, if at all, given the damage that rising rates would probably do to recovery metrics. Keep in mind that history hasn't been kind to this application of fundamental logic in the short term, even if it's ultimately conciliatory. Translation: even though there's a strong fundamental case for support, it could take weeks to materialize, and months if NFP works against it.

For MBS, things are a bit more bleak. The following charts require a bit of a shift from the normal brainwave requirements for MBS chart viewing. Although "higher" is still technically "better," we're not looking at prices here. Rather, this is the gap between Fannie 3.0s and 3.5s. The lower the white line, the further Fannie 3.0s have fallen relative to Fannie 3.5s, essentially illustrating the inherent negative convexity in MBS (where the lowest coupons experience disproportionate pain in selling trends). If 3.0s and 3.5s were selling at the same pace, the line would be perfectly horizontal. So to recap: lower = 3.0s slipping off the edge. Higher = 3.5s being pushed into a ceiling (unable to keep pace with 3.0 rally).

The chart notes the "zones" in which certain coupons tend to dominate production. Under the dotted line, we were already shifting toward more 3.5s, but the point was hammered home after Fed Wednesday. The lower chart suggests that there's still hope to snap back just after a zone has been broken, but the window is limited. In this case, we probably need something to happen by the end of next week. A big enough miss on NFP would probably do the trick. Before that, of course, we have to get through this week. Some highlights:
Tuesday:
- S&P Case Shiller Home Prices at 9am are interesting to Housing/Mortgage markets, but not much of a market mover.
- Ignore Chicago Midwest Manufacturing (not included on our econ calendar)
- Consumer Confidence at 10am is a moderate potential market mover and the only piece of data on Tuesday to claim that honor
- 2yr Treasury auction at 1pm is irrelevant
Wednesday:
- lack of data in general
- MBA Mortgage Index is interesting to mortgage markets, but not a market mover
- 10yr Treasury Auction is the most significant single point of data on the calendar at 1pm
Thursday
- Q1 GDP - our second look at it now, and less of an impact expected unless it deviates greatly from the +2.5 pct consensus
- Initial Jobless Claims at the same 830am time slot could be more meaningful than the GDP data if it continues or improves upon the trend toward lower claims tallies in 2013.
- Pending Home Sales at 10am isn't insignificant, but less so than the other data.
Friday
- Incomes and Outlays at 8:30am is roughly in the same category of market movement at GDP--not to be taken too lightly or too seriously; can cause noticeable movement or none at all
- Chicago PMI at 9:45 tends to cause a pop at 9:42am if it's going to deviate much from consensus. Even then, it's a potential market mover
- Consumer Sentiment at 9:55am is the last significant data of the week
|
Week Of Mon, May 27 2013 - Fri, May 31 2013 |
|||||
|
Time |
Event |
Period |
Unit |
Forecast |
Prior |
|
Tue, May 28 |
|||||
|
09:00 |
Case Shiller Home Prices |
Mar |
% |
0.7 |
0.3 |
|
10:00 |
Consumer confidence |
May |
-- |
71.0 |
68.1 |
|
13:00 |
2-Yr Note Auction |
-- |
bl |
35.0 |
-- |
|
Wed, May 29 |
|||||
|
07:00 |
MBA Mortgage market index |
w/e |
-- |
-- |
791.0 |
|
13:00 |
5yr Treasury Auction |
-- |
bl |
35.0 |
-- |
|
Thu, May 30 |
|||||
|
08:30 |
GDP Final |
Q1 |
% |
2.5 |
2.5 |
|
08:30 |
Initial Jobless Claims |
w/e |
k |
340 |
340 |
|
10:00 |
Pending sales change mm |
Apr |
% |
1.0 |
1.5 |
|
13:00 |
7-Yr Note Auction |
-- |
bl |
29.0 |
-- |
|
Fri, May 31 |
|||||
|
08:30 |
Personal Consumption (Outlays) |
Apr |
% |
0.1 |
0.2 |
|
08:30 |
Personal income |
Apr |
% |
0.1 |
0.2 |
|
09:45 |
Chicago PMI |
May |
-- |
50.0 |
49.0 |
|
09:55 |
U.Mich sentiment |
May |
-- |
83.7 |
83.7 |
|
* mm: monthly | yy: annual | qq: quarterly | "w/e" in "period" column indicates a weekly report * Q1: First Quarter | Adv: Advance Release | Pre: Preliminary Release | Fin: Final Release * (n)SA: (non) Seasonally Adjusted * PMI: "Purchasing Managers Index" |
|||||


