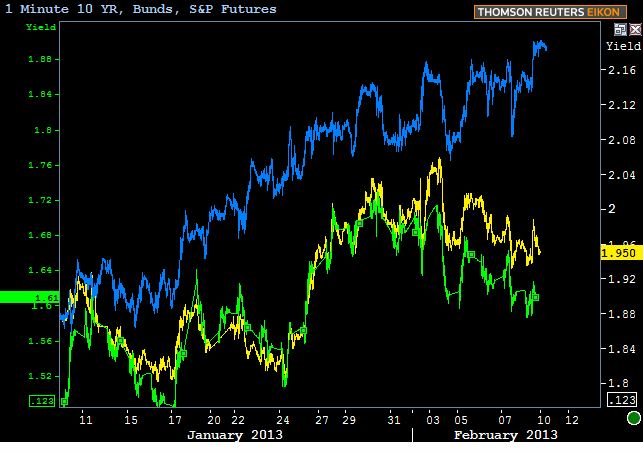
After a reasonable amount of weakness in the morning, broader bond markets were able to ratchet down to some of their best levels since January 25th by the end of last week. Unfortunately, that's not saying much considering that 10yr yields were at roughly the same levels on 3 other days of the week. 1.95, plus or minus 0.01 has been the scene of most resistance (read: floor) bounces during that time, and while it's refreshing to not be pushing up against the ceiling at 2.04, the longer we continue to have trouble moving back through the floor, the more it does to change the long term outlook.
Market movements on 1/25 continue to stand out as the most recently significant shift for Treasuries and MBS alike. That was the day where the ECB's LTRO repayment statistics hit, sending German Bunds, Euros and Treasuries quickly to their recent highs. In the bigger picture, domestic equities markets did very little on that day compared to the gyrations seen in Bunds and Treasuries.

Even through the 24ths, note that the trading range in Treasuries (yellow line) was well-contained and still trending lower. The successive "lower high" for Bunds (green line) on January 22nd was a promising technical development for bond bulls as well. The LTRO news clearly caused a quick bit of panic and a fast "repricing of risk" in bond markets.
Bunds have been unwinding it since early the following week (note the lower highs in the green line starting on 1/28). Treasuries on the other hand, had near-term concerns in the form of the looming FOMC announcement and NFP data on Friday. Yields were stretched to their recent highs during domestic hours (the chart featured is 24 hours, and 10yr yields were, in fact, higher in the overnight session) early on the Monday morning following NFP, but even they were able to get on board with a gradual recovery since then.
On thing that Treasuries haven't been able to do is to break back into the territory that prevailed before the ECB news, but German Bunds HAVE... Why?
There are several possible explanations here. Easiest to accept are the ones that deal with the near-term challenges for Treasuries that could have prevented them from moving quickly back lower in yield. These include the asset allocation trade (portfolio managers sell bonds to buy stocks or vice versa... wax-on, wax-off), major US-specific market data/events (FOMC and NFP), and more Treasury-specific events in the current week with the round of 3, 10, 30yr Auctions to take down.
Between these factors and next week's FOMC Minutes, it's more than fair to consider that Treasuries are playing it safe. If Bund yields continue dropping, it wouldn't take too stellar an auction cycle to firmly challenge the long term pivot at 1.92. If Treasuries do that, it adds serious long term support for Fannie 3.0 MBS at 103-00.
|
Week Of Mon, Feb 11 2013 - Fri, Feb 15 2013 |
|||||
|
Time |
Event |
Period |
Unit |
Forecast |
Prior |
|
Mon, Feb 11 |
|||||
|
-- |
No Significant Data Scheduled |
-- |
-- |
-- |
-- |
|
Tue, Feb 12 |
|||||
|
13:00 |
3-Yr Note Auction |
-- |
bl |
32.0 |
-- |
|
14:00 |
Federal budget, $ |
Jan |
bl |
-21.00 |
-0.26 |
|
Wed, Feb 13 |
|||||
|
07:00 |
Mortgage market index |
w/e |
-- |
-- |
849.8 |
|
08:30 |
Import/Export Prices |
Jan |
% |
0.7 |
-0.1 |
|
08:30 |
Retail Sales |
Jan |
% |
0.1 |
0.5 |
|
10:00 |
Business Inventories |
Dec |
% |
0.3 |
0.3 |
|
13:00 |
10yr Note Auction |
-- |
bl |
24.0 |
-- |
|
Thu, Feb 14 |
|||||
|
08:30 |
Initial Jobless Claims |
w/e |
k |
360 |
366 |
|
13:00 |
30-Yr Treasury Auction |
-- |
bl |
16.0 |
-- |
|
Fri, Feb 15 |
|||||
|
08:30 |
NY Fed manufacturing |
Feb |
-- |
-2.50 |
-7.78 |
|
09:15 |
Industrial Production |
Jan |
% |
0.2 |
0.3 |
|
09:15 |
Capacity utilization mm |
Jan |
% |
78.9 |
78.8 |
|
09:55 |
Consumer Sentiment |
Feb |
-- |
74.2 |
73.8 |
|
* mm: monthly | yy: annual | qq: quarterly | "w/e" in "period" column indicates a weekly report * Q1: First Quarter | Adv: Advance Release | Pre: Preliminary Release | Fin: Final Release * (n)SA: (non) Seasonally Adjusted * PMI: "Purchasing Managers Index" |
|||||


