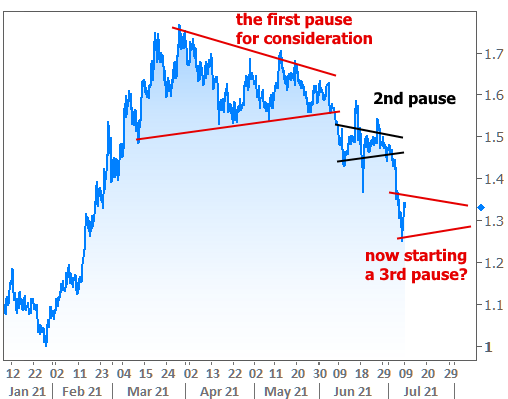
Big changes in the economic landscape bring big opportunities to consider whether bonds are priced where they should be. The entire spring and summer of 2020 was spent in such a pause for consideration as traders increasingly agreed that "peak covid" was worth 10yr yields in a narrow range surrounding 0.60%.

The next 6 months saw rates move higher as market's priced in an improved outlook. Then, starting this spring, we've seen a new series of pauses as traders consider what the near-term holding pattern should look like between now and whenever we feel like have enough data and progress against covid (or lack thereof) to decide on an appropriate rate range going forward.
This week could be seen as an expedition to a new, lower-rate consolidation range. If that's the case, then Thursday's rally makes a strong case for the bottom of that range and we're now in the process of finding out where the opposing ceiling will be.
Rather than view 2021 as a series of sideways ranges, we could simply say that, after rising up and out of the covid-inspired doldrums, rates topped out early this spring and are now in a broad, volatile downtrend (with Thursday being an outlier).

This most recent chart makes a case for a bit more weakness as the implication is a return to the upper red line. But the chart before that suggests sideways range-finding centered on the low 1.3's. Unless the rest of the day brings a staggering amount of weakness, we won't find out which option we get until next week. Thankfully, we won't have to wait too long thanks to the condensed auction calendar.


