Lets look at the evolution of trader sentiment this week...
Below is a three day chart illustrating the price action of the September 10yr Treasury Futures Contract. On Tuesday, July 21, a considerable rally ensued in the rates market, taking the TYU price from 116-15 to 117-31. Lets look at how that rally evolved and examine the market's follow up reaction...
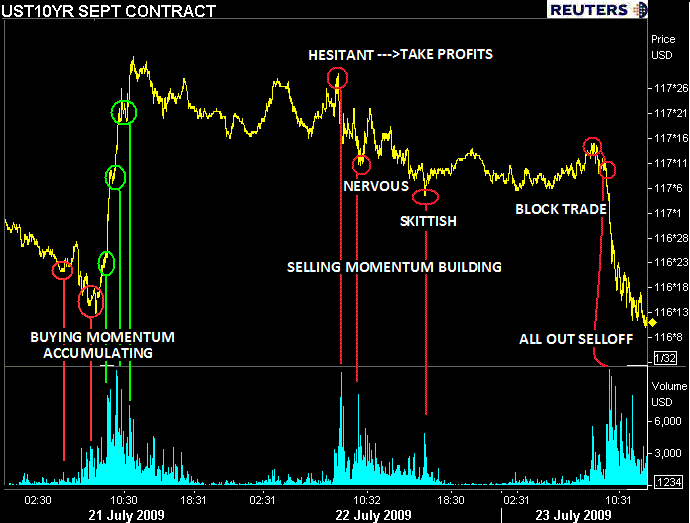
First notice that as prices neared the 116-15 low on Tuesday morning, volume began to pick up as bargain buyer's interests increased. Momentum then began to accumulate and volume grew as short positions were covered. Then as bandwagoners jumped on the bus...the snowball grew, volume peaked, and a facemelting rally ensued. Then, as the rally lost momentum, volume tapered off and and the rally slowly cooled off.
Following the facemelter, buyers showed signs of mixed outlooks on Wednesday, illustrated by the slow downward price trend. Some took profits as prices hit intraday highs, others attempted to add positions at intraday lows. Notice one thing though...while the market made new lows, volume began to increase as more and more began to exit positions. A snowball was beginning to form as seller's were slowly taking control...
Then this morning the snowballing intensified. Notice after probes at 117-16 failed, prices began to move lower and volume started to increase. This illustrates sellers beginning to consume the marketplace. Then, as the TYU crossed over 117-00, one account made a big move...selling 11,713 contracts at once, the snowballing of seller sentiment had reached its peak....we had to issue several ALERTS as the 10 yr TSY led "rate sheet influential" MBS prices lower and lower.
After positions were closed, the market began to stabilize and volume once again leveled out. Currently, the 10 yr contract has found support where prices opened on Monday morning...at 116-00 (not on chart)...near 3.70%.
The above chart is a way for us to show you the buying and selling behavior of market participants at specific price points. What is currently considered cheap? What price levels are traders taking profits? Are traders buying at higher lows? Selling at lower highs?
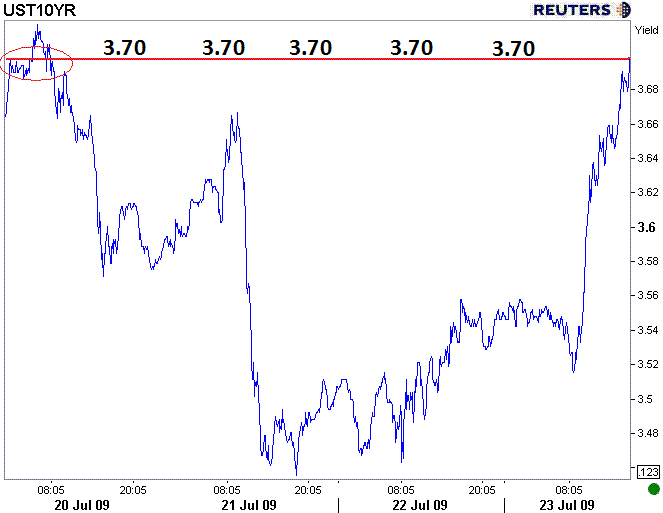
Here's how the price action looks in yields...right back to Monday open levels. 3.70 support holding...
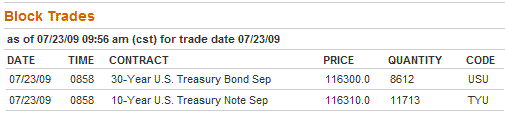
More on that block trade...
In the comments of the MBS ALERT post that warned you of looming re-prices, I informed you that a rather large trade had occurred in the futures market, adding steam to seller momentum. The trade: one account sold 11,713 Sept 10 yr TSY contracts and bought 8,612 September 30 yr contracts...simultaneously.
In those comments I stated that this had positive implications for mortgage rates. Why?
This trading strategy is called a "Notes Over Bonds" spread trade. The underlying assumption of this speculative positioning is the notion that the yield curve must flatten for the trade to pay off.
Plain and Simple: this strategy illustrates one trader's/account's bias that the spread between long-term TSY rates and short term TSY rates is going to narrow as the yield curve flattens. The buyer feels that there is money to be made because the yield curve has aggressively steepened in the past 24 hours and they speculate that a correction will occur.
Well...a flatter yield curve is a good thing for Mortgage Rates
______________________________________________________________________
PAUSE FOR EDUCATIONAL OPPORTUNITY
Reminder: as prices of benchmark TSYs move higher and yields move lower, the duration of "rate sheet influential" MBS coupons decreases. This means the prices of current coupon/"rate sheet influential" MBS less sensitive to a small rise in benchmark rates and allows/forces certain MBS holders to move "down in coupon" to match the duration of their liabilities with the duration of their assets (loan servicers are big convexity buyers). Moving "down in coupon" into lower coupon MBS adds duration to the portfolio.
If nothing more, beyond the additional demand side support rate sheet influential" MBS coupons..."rate sheet influential" MBS prices will rally as the long end of the yield curve corrects...granting lenders the opportunity to sell their pipeline of mortgage loans for a higher price...allowing lenders to offer lower mortgage rates.
END EDUCATIONAL MOMENT
___________________________________________________________________
So...even though this NOB position is speculative, the fact that market participants are positioning for a correction of the recent sell off should help you look at this situation from a glass half full perspective. Maybe? Kinda? Just a little? Maybe not? Stocks might deflate our hopes :-(
Here's the FN 4.5 price action so far this week..
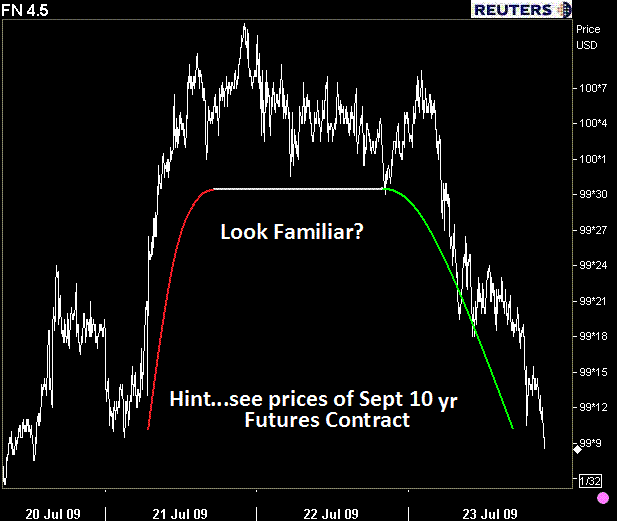
Plain and Simple: Looks like our outlook for volatility was well timed
2s vs. 5s: 153bps
2s vs. 10s: 265bps
5s vs. 10s: 112bps
Interest Rate Volatility = HIGHER
Stock Market Volatility = HIGHER THEN LOWER
The S&P = FREIGHT TRAIN. Except now more riders are jumping on board. 1000 next stop? Mutter muuuuttter
NYMEX CRUDE: 67.19
Dollar Index: 78.79
Gooooooold: 950


