It's the first Wednesday of the month and thus time for ADP Employment data. The stated intention of this report is to predict the final revision of the official nonfarm payroll (NFP) count in the big jobs report that follows 2 days later. Because of its connection to NFP, ADP payroll data has been a very big market mover at times. But because NFP counts and revisions have often defied logic, ADP (which is arguably in a much better position than the US government to keep a timely and accurate finger on the pulse of payrolls) has also been called into question in terms of relevance.
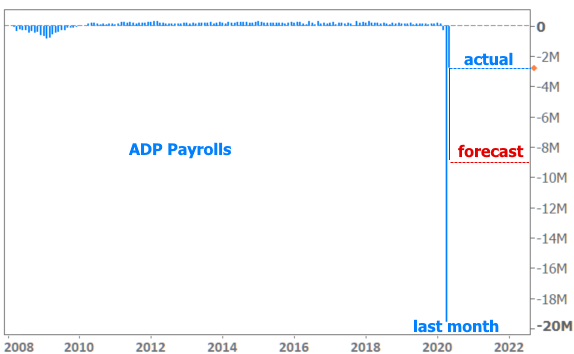
Despite that, a BIG beat or miss in the ADP data has always been worth something to the bond market--at least during times where the bond market is tuned in to payrolls counts. Now today, we have the biggest-ever beat (i.e. the payroll count was much higher than expected). Ironically, it is also the 2nd worst payroll count of all time according to ADP. In other words, expectations were for staggeringly awful job losses (-9 million) and the actual report was merely awful (-2.76 million). Everything's relative when it comes to econ data.
As recently as yesterday, I reiterated that the bond market doesn't have much of a reason to pay attention to employment data until it gets much closer to a more normal historical range. After all, if we're still counting payrolls that are millions weaker than any historical frame of reference, we're obviously still in the thick of the unprecedented coronavirus labor market drama. We actually need to see jobs ADDED to the economy before we'll truly have a sense of a shift. Negative numbers are merely measuring how quickly jobs continue to go away.
All that having been said, the market can't help but pay some attention to such a big beat in economic data. The fact that it has only been worth a few bps of weakness--if that--in Treasury yields is a testament to the bond market's generally dispassionate stance on data. The problem today is that it only takes a few more bps of weakness to create big questions for the broader trend. The existing losses already put yields back in the previous uptrend (yellow lines below). If this weakness remains intact, it also triggers a shift in momentum indications (purple line crossing above green line in the stochastic oscillator at the bottom of the chart). And perhaps most simply, if yields break above .74% by any meaningful amount, it would be the first time in that territory since early April.


