Good Morning All.
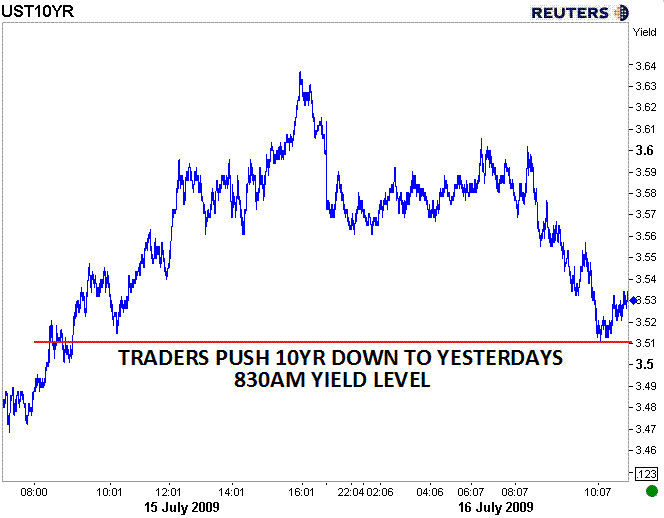
Traders have pushed the 10 yr TSY note back to yesterday's 830AM (pre data) yields, indicating the market is looking to test the strength of yesterday's selloff. After three straight days of progressively more intense selling, the long end of the yield curve is oversold, which implies the currently flatter curve is a function of market participants consolidating positions so they can continue poking and prodding at resistance and support levels before the weekend.
Plain and Simple: traders are looking for confirmation of the extent to which they steepened the yield curve over the past three days. This rally is not providing any long term guidance (yet).

Here is a daily look at the 10 yr note (hourly shows oversold)...although I use the price of futures contracts when doing retracement analysis, we can correlate future prices to current yields, so this chart still works. At the moment traders are testing the 38% retracement level. Notice the correlations of yield movements to retracement levels? TRADER'S MARKET PEOPLE...TRADER'S MARKET!!!

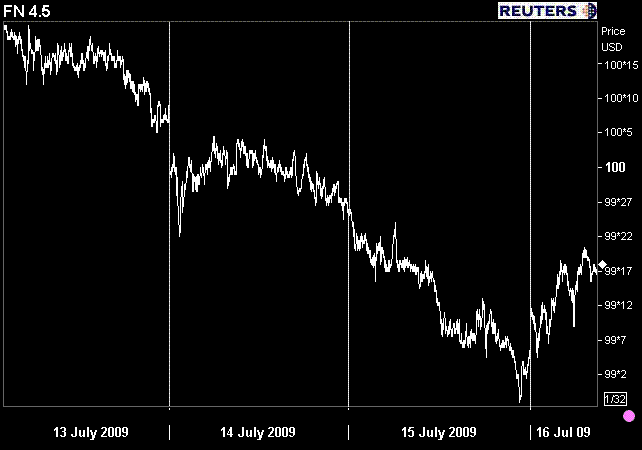
The flatter yield curve (gettin crushed) has had positive effects on prices of "rate sheet influential" MBS coupons this morning (yield spreads are wider though). The FN 4.5 is currently +16/32 at 99-18 yielding 4.56%...fyi as the FN 4.5 approaches par its yield falls 8bps to 4.48, however at 100-16 yields only fall to 4.40%.
As MBS prices rise originators are more likely to become sellers. Remember when mortgage bankers sell MBS, they are locking in their loans in an effort to hedge their pipeline from interest rate risk. This is good selling for you as it locks in prices for lenders.
Anyone seeing some aggressive rate sheets relative to current MBS pricing? WE ARE....this is because lenders locked in a good amount of loans in early July..at MBS price highs. Because mortgage bankers locked in their loans already, they have the opportunity to offer pricing as if MBS prices were still at last week's price highs, regardless of current MBS market bid/ask. Make sense to you? If you are farther down the mortgage pricing supply chain you are not likely to see this rate sheet resiliency. However if you are using a direct seller rate sheet...you should be seeing rates in the low 5.0s (base pricing).
Here is the week over week...notice the FN 4.5 is running into resistance near yesterday's 830AM price levels (see corrective probing explanation above).

In stocks, the S&P is essentially flat, but moving into a tighter range. Last night I discussed the notion that traders will not likely get in the way of the market's momentum...well the momentum is currently bullish. The fact that volume is LOW and prices are at KEY RESISTANCE LEVELS indicates that traders are hesitant to make a move in either direction...traders are in "wait and see" mode...not getting in the way of momentum! Which is why the S&P is flat...

All that said...dont get complacent with this morning's rally in rates. No short term indications can be taken away from current market technicals. STAY ALERT IF YOU ARE FLOATING SHORT TERM, trying to make up some lost YSP (base pricing + servicing!!!). And remember..the British Open is on TV, you can bet your rear that traders have it turned on within their line of vision (on mute). Distracted traders in low volume...ooo could get interesting later..or just really boring.
2s vs. 5s: 145bps
2s vs. 10s: 257bps
5s. vs. 10s: 112bps
Oil: $61.22 (holding pattern)
EUR/USD: 1.4109 (holding pattern)
USD/JPY: 93.56 (holding pattern)
VIX: 25.47 (holding pattern)
3m/10yr Implied Interest Rate Volatility: 186bps (slightly lower)


