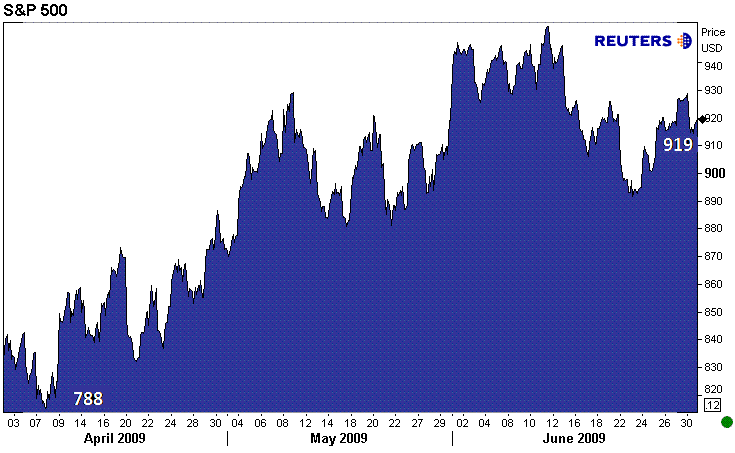
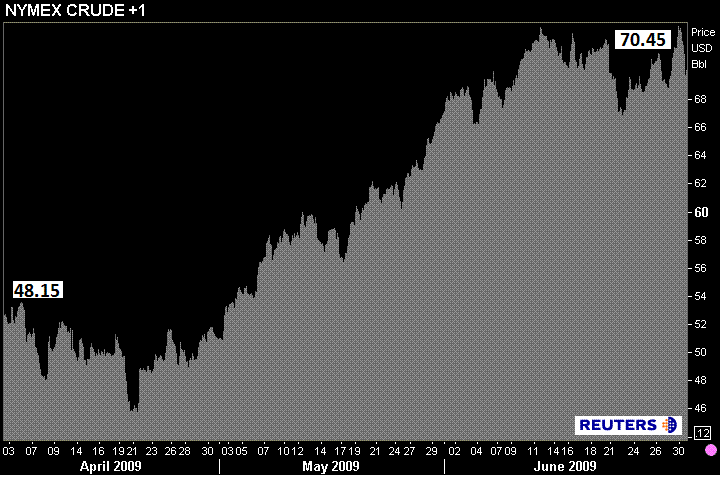
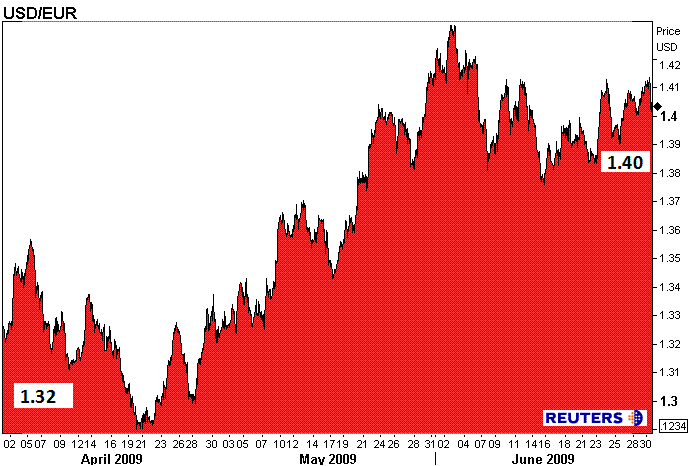
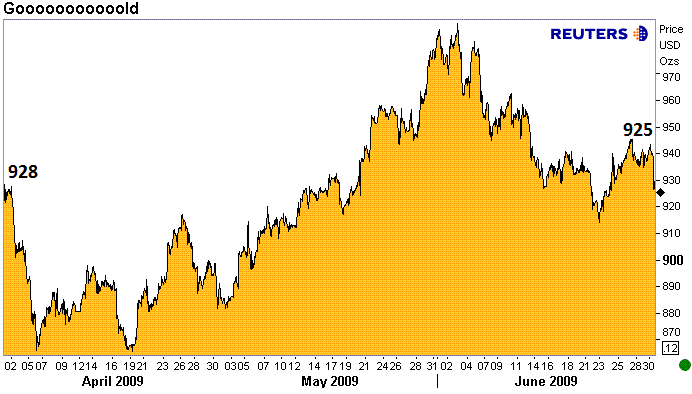
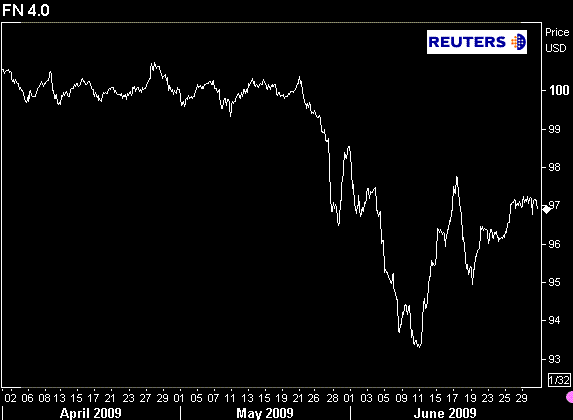
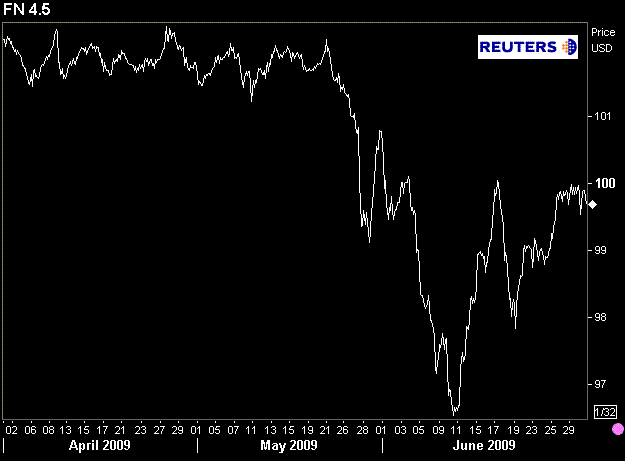
Quarter 2 has come to an end....
Here are some charts to illustrate the evolution of the marketplace in 2Q 2009:
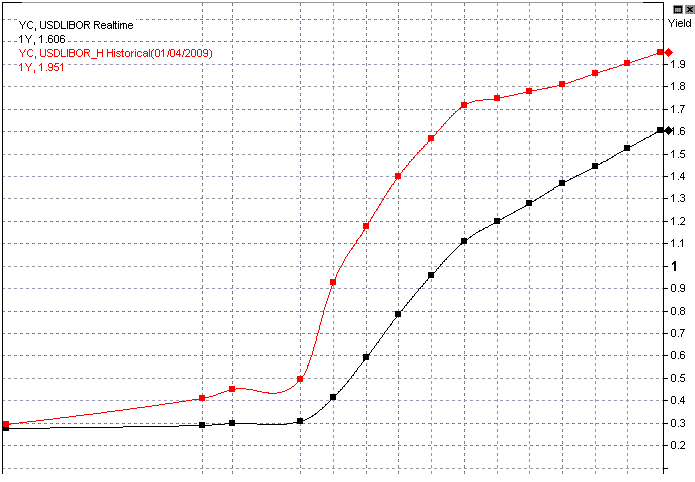
LIBOR CURVE
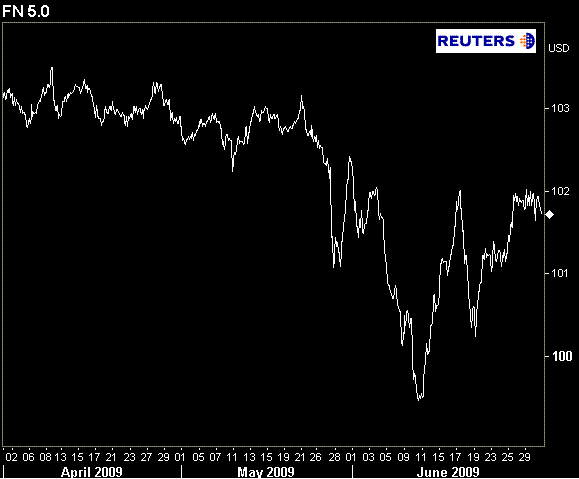
AND LAST BUT NOT LEAST....
I think I adequately laid out "WHAT NOW" in MBS AFTERNOON
The Economic Calendar Tomorrow...
PS...I would have like to included a chart illustrating the evolution of mortgage rates, but I am not a fan of any of the surveys as they are not borrower specific and often times create borrower misconceptions.
FYI: Mortgage rates went up if you were wondering! :-D
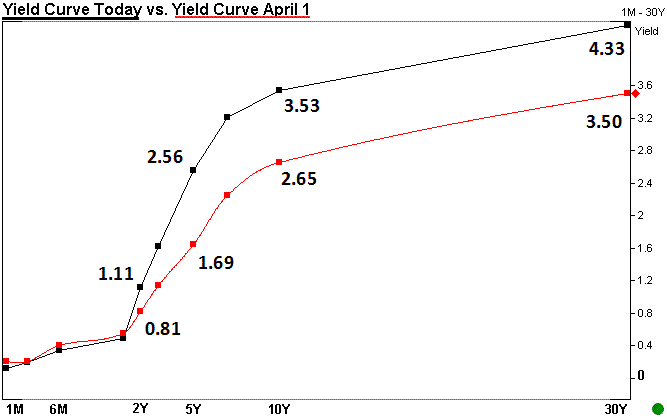
2s vs. 10s: 241bps


