The Treasury and MBS markets have remained highly volatile, with Thursday's price action (in front of the Employment report on Friday) continuing their erratic behavior. The standard deviation of the 10-year yield over a 60-day period (a good measure of volatility, I believe) is the highest it's been since mid-March, right around the time that the Fed announced its program of purchasing intermediate and long Treasuries. At the same time, MBS have widened sharply since late May.
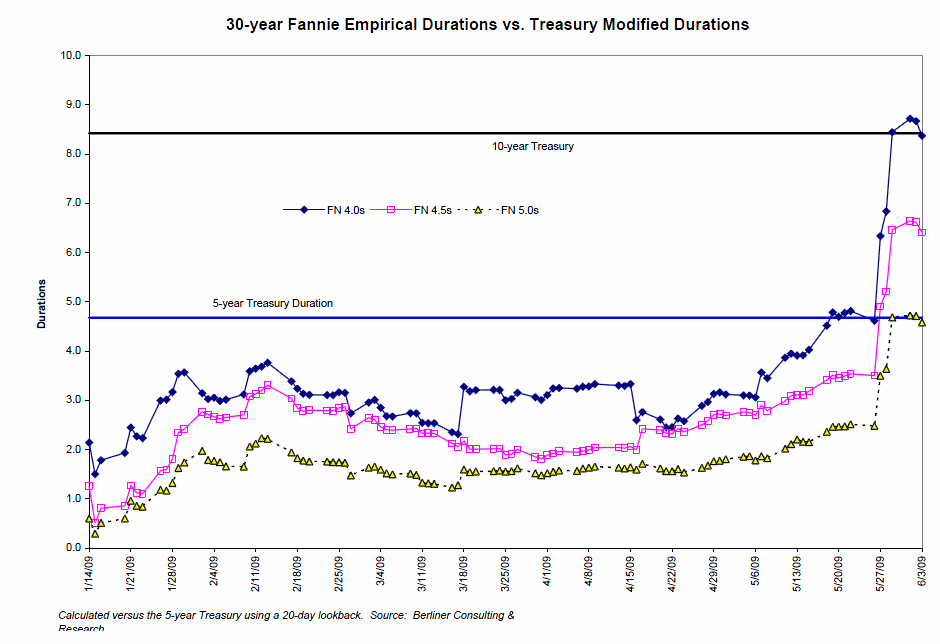
There are a few factors pulling on the mortgage market. As a so-called "spread product" (i.e., bonds that trade at a yield spread over Treasuries) big moves in the market always throw valuation levels into question. The uncertainty has been exacerbated by a few other factors. Mortgages are trading a lot "longer" than they had only a few weeks ago. This is particularly true for the lower Fannie coupons, such as 4.0s and 4.5s. Once rates began to rise, they went from being the "current coupons" (defined as both the coupons trading around par and the coupons into which most production would be pooled) into deeply out-of-the-money securities. In particular, Fannie 4.0s are comprised of loans carrying the lowest note rates in a generation. With housing turnover slowing and a small probability of being "refinanceable," these are very long securities; it's easy to imaging them as being the equivalent of 10-year maturity Treasuries and corporates. The chart below illustrates this phenomenon. It shows the empirical durations (versus the 5-year Treasury) of Fannie 4.0s though 5.0s, along with the approximate modified durations of 5- and 10-year Treasury notes. By this measure, Fannie 4.0s have traded to the same duration as the 10-year Treasury, while Fannie 5.0s have traded as the equivalent of a 5-year Treasury.

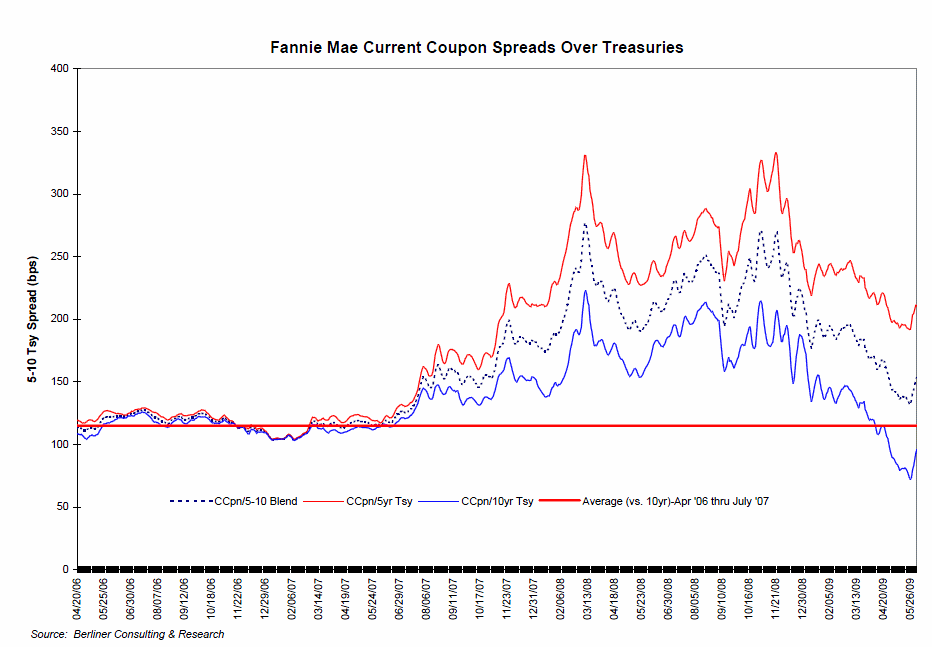
The duration extension also brings into question the proper benchmark on the yield curve for comparing spreads. Updating a concept I initially addressed a month ago, the chart below shows the spread between the Fannie Mae current coupon rate and various points on the Treasury curve. The chart indicates that MBS remain pretty fairly valued versus the 5-10 sector of the curve, and look cheap to 5-years; compared to 10-years, however, they look hideously tight. When MBS were trading to shorter durations, it made sense to compare them to the shorter maturities on the curve. however, newly extended MBS now look very rich to longer parts of the curve using their historical averages. This is admittedly a crude form of analysis; however, I think it gives a pretty good sense of why MBS have struggled recently, especially the lower coupons.

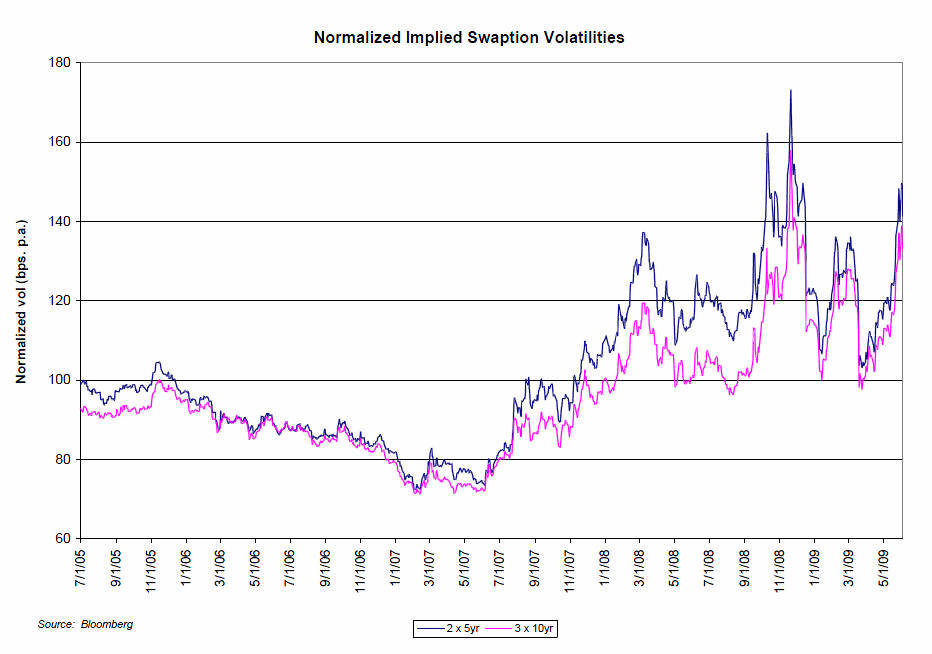
The other major factor in MBS weakness is the runnup in implied volatilities. There are a lot of ways to measure implied (i.e., price-implied) volatility, but the most commonly used instruments are swaption vols. The chart below shows "normalized" swaption vols over time; these are levels (in basis points per year) that options on swaps are currently trading. (As an example, a 2x5 swaption is a 2-year option on a swap with a 5-year term. Longer option terms are typically used for gauging MBS values and performance.) While this sounds fairly complex, the relationship between volatility and MBS values is fairly simple. Mortgages (and MBS) can be thought of as being comprised of a bond with a short position in an option. Since higher volatility causes option values to increase (as it becomes more likely for the underlying asset to trade in-the-money), the short option position embedded in mortgages means that higher vol hurts their valuations. Therefore, the recent jump in option values (reflected in higher implied volatilities) means that, all things equal, MBS had become expensive, and needed to cheapen in order to be attractive in any framework that takes optionality into account. (One way of looking at this is to use so-called option-adjusted spreads, or OAS; by the end of last week, Fannie 4.0s were trading to an OAS versus swaps of almost -20, a level that's not terribly enticing to value shoppers.)

I don't expect MBS to regain their footing until the long end of the Treasury market establishes a fairly clear trading range. While the yield on the 10-year has bumped up against the 3.75% level a few times, it's unclear whether that represents the higher end of a new range or a stop on the road to 4%. If and when the 10-year resumes trading in a definable range, implied vols can head lower and MBS spreads can stabilize. A key hurdle will be Friday's employment report; payrolls and unemployment numbers better than expected will likely cause 10-year yields to test the 3.75% level. Given their tightness to the long end of the curve, however, I don't look for the current coupons (particularly 4.5s) to tighten significantly unless the Fed announces more (and larger) MBS purchases.
Bill Berliner is a mortgage and capital markets consultant based on Southern California. His web site is www.berlinerconsulting.net.


