Good Morning Good Morning Good Morning.
Record low Housing Starts and Permits initially pushed stock markets lower while bonds had a mixed reaction to the "weaker than expected" data. Mid-morning stocks bounced off intra-session lows and bonds illustrated their bearish bias by pushing yields higher. Usually worse than expected economic data is bond booster but Thursday's Treasury Department auction announcement (expecting $100bn+ in 2s/5s/7s) is continuing to keep fixed income market sentiment defensive....plus yield curve investors hate a shortened work week (early close on Friday).
At the moment....the Dow is testing its intraday highs...+21 at 8525. The UST10YR is -0-07 yielding 3.25%. And in SLOOOOW and SLUUUGGGISH trading MBS are...
Since 5pm "Going Out" Marks....
FN30________________________________
FN 4.0 -------->>>> -0-01 to 99-27 from 99-28
FN 4.5 -------->>>> +0-00 to 101-22 from 101-22
FN 5.0 -------->>>> -0-01 to 102-23 from 102-24
FN 5.5 -------->>>> -0-01 to 103-17 from 103-18
FN 6.0 -------->>>> +0-00 to 104-23 from 104-23
GN30________________________________
GN 4.0 -------->>>> +0-00 to 99-24 from 99-24
GN 4.5 -------->>>> +0-01 to 101-25 from 101-24
GN 5.0 -------->>>> -0-03 to 103-13 from 103-16
GN 5.5 -------->>>> -0-03 to 104-00 from 104-03
GN 6.0 -------->>>> +0-00 to 104-20 from 104-20
2s/10s: 235.18bp <--steepest yield curve has been in two weeks
Onto housing data....
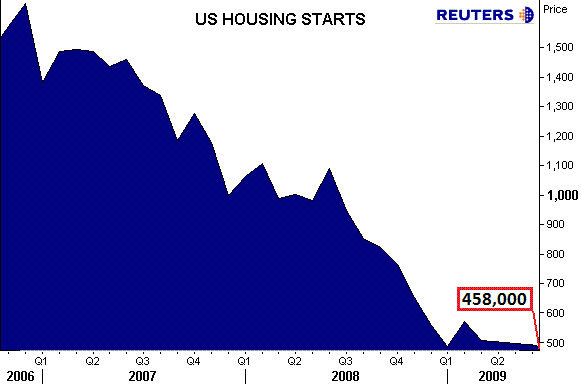
Yeh yeh it was another record low. 458,000 Housing Starts and 494,000 Building Permits (MND COMMENTARY). Here is a chart of Housing Starts.....

BUT....
Single family housing starts in April were up 2.8% at a rate of 368,000 per year...10,000 more than the March reading of 358,000. So the problem was not single family homes...it was in buildings with five or more units!!! Which we all know are a big big problem (think condos).
REMEMBER...Housing Starts tell us how much NEW CONSTRUCTION occurred for residential real estate in the previous month. This means digging has begun. Adding rooms or renovating old ones does not count, builder must be constructing new home (can be on old foundation if re-building). We get single family housing, 2-4 unit housing, and 5 unit and above housing data. Single family housing is by far the most important as it accounts for 70-80% of total home building.
Question: Shouldn't we be happy to let the current supply of "available for sale" homes dwindle before we start building again? Record low housing starts and permits...ok by me. Existing Home Sales is what we care about....
Since I am watching mostly technical indicators to pace and forecast future price behavior of treasuries and MBS here are some of my notes on the 10yr and the yields on "up in coupon" MBS positions....this gets a little technical but provides a decent 10,000 ft point of view.
SELLING INTO STRENGTH is the defensive bias at the moment. 3.25 is your "fulcrum" point that the 10 yr will trade around. 3.23 signals strength but puts profit takers on alert...3.28 signals more weakness but brings buyer attention back to the "buy" button (wave 'em in). I wouldn't be surprised to see the 10 yr yield approaching the 3.30 level and possibly venturing into the low 3.30s though. The stock market is trading in low volume (and contrary indicators making profit taking highly likely) so swings in equity sentiment have the potential to cause volatility in the bond market (especially in a short work week). That volatility will be VOLATILE as it is CONTAINED IN A RANGE!!!!! Furthermore corporate bond spreads (TALF AAA?) are moving tighter and tighter as investors are looking to tap private markets to fund TARP payoffs and rebuild operations....yield curve investors will be picking and choosing whose debt they fund though...nonetheless attention on corporates could be diverting MBS buyers attention from MBS to corporates as the "up in coupon" MBS positions grow increasingly expensive.
Well maybe not...lets explore that with some MBS "relative value" analysis:
At a 40 CPR* the FN 6.5, costing 106-16, is yielding 2.88% with a 2 yr life...the 2 yr TSY note is yielding 0.91 so if you buy a FN 6.5 you are almost 200 bps over the risk free benchmark.
At an 18 CPR* (April' prepay report print) the FN 6.5, costing 106-16, yields 4.77% with 4 yr life. Lets compare those returns to a 5 yr note currently yielding 2.13%. 4.77% - 2.13% = 264 bps. Thats a pretty nice return!!! That is why the Fed is the only MBS market participant buying "rate sheet influential MBS coupons.
That said...perhaps fixed income investors wont venture down the risk supply chain into corporate debt. That decision all depends on the investos perspecrive regarding the timing and certainty of incoming cash flows (when/if you get principle investment back)
*CPR IS ESTIMATED PREPAYMENT SPEED (when borrower will pay off mortgage). PREPAY SPEED IS KEY DETERMINENT OF MBS COUPON YIELD. YIELD DETERMINES YIELD SPREAD WHICH DETERMINES THE RELATIVE VALUE...relative to benchmark TSY that is
I hope I didnt make anyones brain explode...trading flows are slow and I figured I would have a little fun this AM.
Rate sheets are slightly worse.....


