Financial markets are once again discounting the developing economic recuperation following weaker than expected retail sales data. This morning the US Census department revealed that retail sales declined 0.4% in April following a revised for the worse 1.3% drop in March. It gets worse...markets had to digest another record foreclosure reading from RealtyTrac today. The reading: 1 in every 374 households are in foreclosure. In the press release RealtyTrac states that this was the "highest monthly foreclosure rate ever posted since RealtyTrac began issuing its reports in January 2005". The 10 states with the most properties with foreclosure filings in April accounted for more than 75 percent of the national total. California documented the highest total (96,560), followed by Florida (64,588), Nevada (16,266) and Arizona (16,245).
The shaky economic data served as an eye-opening reminder that although the next "Great Depression" may have been avoided.....we still have a long bumpy road of recovery ahead.
On the day the Dow lost 184.22 points (-2.18%) closing at 8,284.89, the S&P shed 24.43 points (-2.69%) to 883.92, and the NASDAQ moved 37.27 points (-2.73%) lower to 1,339.83.
In debt markets, US benchmark government bills, notes, and the long bond benefitted from a yield curve flattening "flight to safety" rally. The price of the 10 yr Treasury note moved 18/32 higher yielding of 3.12%. The steepness of the yield curve, as measured by 2s/10s, flattened by about 5 bps to 224.13bps.
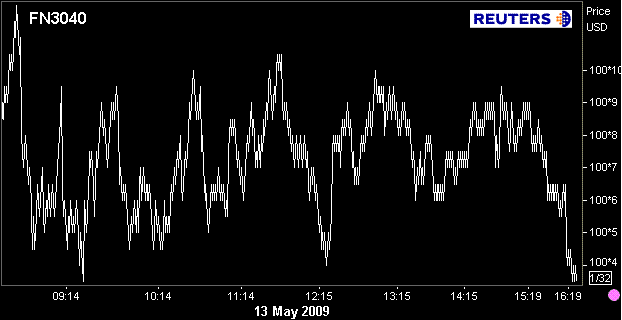
In the MBS market, trading activity remains sluggish (volume close to 30 day average..which is relatively low) and originator supply was once again subdued (third day in a row). The quiet trading flows helped "rate sheet" influential MBS bids remain in a stable Fed supported range for most of the day before prices broke through our downside 100-04 support level as the session neared the 5pm "Going Out" time frame. In regards to the late day selloff...market flows have been slow and technically the MBS market closes at 3pm. Therefore we arent putting much stock into the late afternoon weakness. The Fed continues to be the main source of liquidity in the bottom half of the stack while real money and levered (borrowed money) accounts continue to churn profits/day trade fuller shorter duration MBS coupons like the 6.0 and 6.5.
Looking ahead we remain focused on short term trading strategies..duration shedding (selling rate sheet influential coupons) will be an issue for MBS if new economic reports are better than expected and bond traders broadly exit their flight to safety positions across the curve. On the other hand...if reports are "better than expected" and MBS rally...we expect the originators we discussed this morning will do some profit taking of their own. This may lead to a few moments of panic but, as has been the case over and over again, the Fed has provided an overwhelming amount of support to mortgage bankers/originators looking to protect their pipelines from interest rate risk.
How much will prices fluctuate? MBS continues to be sheltered from the extent to which the stock lever forces a TSY sell off...but we want to be sure to remind all that mortgages still take their directional guidance from the yield curve. If TSY sell, MBS sell too but not as much. If TSYs rally, MBS rally too, but not to the same extent.
Plain and Simple: MBS will continue to be subjected to the sentiments of stock traders. (Jobless Claims at 830am tomorrow, PPI at 830 as well). All in all...the range trade moderates MBS...barring any tape bombs that send the yield curve markedly steeper or flatter we should remain near recent price levels. Sittin sideways....
Since 5pm "Going Out" Marks....
FN30________________________________
FN 4.0 -------->>>> +0-05 to 100-04 from 99-31
FN 4.5 -------->>>> +0-03 to 101-28 from 101-25
FN 5.0 -------->>>> +0-06 to 102-29 from 102-23
FN 5.5 -------->>>> +0-05 to 103-23 from 103-18
FN 6.0 -------->>>> +0-01 to 104-26 from 104-25
GN30________________________________
GN 4.0 -------->>>> +0-03 to 100-05 from 100-02
GN 4.5 -------->>>> +0-05 to 102-02 from 101-29
GN 5.0 -------->>>> +0-07 to 103-20 from 103-13
GN 5.5 -------->>>> +0-04 to 104-05 from 104-01
GN 6.0 -------->>>> +0-01 to 104-24 from 104-23
Just for your own perspective tomorrow...here's 3pm closing marks.
3 pm Closing Marks....
FN30_________________
FN 4.0 -------->>>> 100-08
FN 4.5 -------->>>> 102-00
FN 5.0 -------->>>> 103-00
FN 5.5 -------->>>> 103-24
FN 6.0 -------->>>> 104-27
GN30________________
GN 4.0 -------->>>> 100-18
GN 4.5 -------->>>> 102-14
GN 5.0 -------->>>> 104-03
GN 5.5 -------->>>> 104-14
GN 6.0 -------->>>> 104-29
Here's the day over day chart illustrating the intraday trading range...

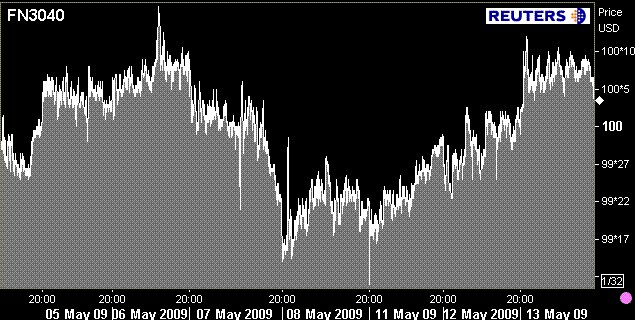
Here's a broader look at previous price behavior...it appears that prices have moved in a wide range but it should be noted that tests of our long term lower support levels resulted from a broad shift in bond market sentiment (FOMC meeting). Even then MBS prices have held stable and returned to levels near 100-00. If the FN 4.0 ventures too far into the par price handle...look for originators to take profits (hedge pipelines). If prices test our 99-19 long term support...look for bargain buying to restore order. Range bound!

The slowdown in retail sales indicates that consumers are still strapped for cash and battling their own balance sheet insolvency (further demonstrated by foreclosure report). This morning I asked if your pipelines were thinning and production was tapering off. I got some feedback that indicates lending action is indeed slowing down a bit. The reason I asked is because we are beginning to believe that the pool of "refinanceable" borrowers is dwindling and maybe nearly extinguished. Can that be changed?
In a report released by FTN Financial yesterday, it was called to attention that lender operational constraints and higher investor rate sheet margins were the driving force behind slower than expected prepayment speeds (borrowers not refinancing). Although we agree that lenders are holding back yield spread, we do not believe that the operational capacity explanation holds as much weight as it did in January and February. Instead we blame the loan level price adjustments imposed by the GSE'S and the additional risk adjustments tagged on by mortgage lenders.
The labor market is by no means done shedding jobs, borrowers are still cutting back spending, and consumers are losing their lines of credit. All the while credit scores are suffering...making it harder and harder to qualify for a new mortgage because of huge loan level price adjustments. Instead of lowering base mortgage rates (because a perfect borrower can still get a record low rate) we urge the GSEs to cut back their loan level price adjustments. This is a step in the right direction. Once primary mortgage pricing improves and borrowing costs for credit impaired consumers move lower...then perhaps we should revisit the "operational capacity" issue.
This brings a bigger issue to light...FICO scores. Are the risk models used by the credit bureaus in need of reform? So much is based off of credit scores, yet I continually receive emails inquiring as to why a credit score would drop 40 points in one month. Furthermore...are the GSE underwriting (risk) models also in need of reform? So much of the loan underwriting process is based on the scores reported by FICO. Perhaps the GSEs underwriting models should be more weighted on debt to income ratios and employment history? Many ideas come to mind but one thing is for sure...the entire mortgage related risk model is in need of a few tweaks. Mortgage rates are at record lows and borrowers arent knocking down the doors of ready and willing loan officers...something isnt right and we are not prepared to put the full blame on lender operational constraints and extra juice in rate sheets. Perhaps we will dive into this a little further in the future. Any thoughts on the topic?


