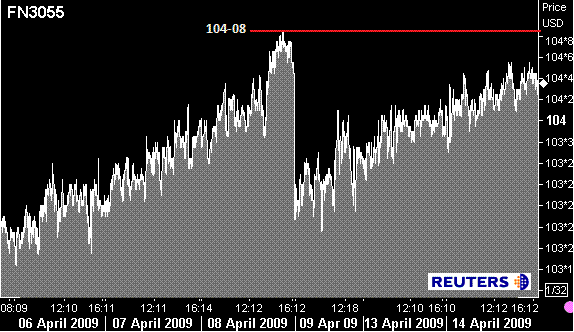
MBS traded in a stable upward trend channel all day (see last post for chart) . Reprices for the better were reported, but republished rates were not widespread. Treasury yields also moved lower throughout the day as stocks sold off on weak retail sales data (-1.1% in March after two months of rising sales). The contraction in retail sales put investors in the state of mind that perhaps the economy hasn't hit bottom yet. Consequently the Dow finished 137.63 points lower (- 1.71%) to 7925.72. The S&P 500 declined 17.21 points (-2.00%) to 841.52. The NASDAQ dropped 27.59 points (-1.67%) to 1625.72.
The exodus from equities resulted in the 2 yr TSY note rate falling from 0.88% to 0.86% and the 10yr TSY note rate falling to 2.79%. 2s vs 10s flattened 5 bps to 192bps. MBS/TSY yield spreads moved wider most of the day but tightened up a few ticks as we neared 5 pm "Going Out" marks (bc TSYs sold off a bit and MBS continued to move higher)....
Since 5pm "Going Out" Marks....
FN30_______________________________
FN 4.0 -------->>>> +0-10 to 100-07 from 99-29
FN 4.5 -------->>>> +0-07 to 102-01 from 101-26
FN 5.0 -------->>>> +0-05 to 103-09 from 103-04
FN 5.5 -------->>>> +0-03 to 104-04 from 104-01
FN 6.0 -------->>>> +0-01 to 104-26 from 104-25
GN30________________________________
GN 4.0 -------->>>> +0-09 to 100-14 from 100-05
GN 4.5 -------->>>> +0-07 to 102-09 from 102-02
GN 5.0 -------->>>> +0-05 to 103-29 from 103-24
GN 5.5 -------->>>> +0-03 to 104-13 from 104-10
GN 6.0 -------->>>> +0-03 to 104-25 from 104-22
Lots to talk about tomorrow....even though some of the releases may overshadow others here's what data is coming:
0700 : MBA's Weekly Mortgage Applications Index. Last week the MBA reported that refinance mortgage applications increased 3.2% and the average 30 yr fixed mortgage rate was 4.73%. Did you continue to take a bunch of new apps over the past 5 days? The holiday period may have slowed down new applications. But you never know...the internet is a wonderful thing and consumers had some extra time on their hands over the weekend.
0830: March Consumer Price Index (INFLATION IS THE ENEMY OF FIXED INCOME!!!) February headline CPI data indicated a 0.2% increase in consumer price levels. Economists are forecasting a 0.10% increase in March.
Just a thought on inflation and its relation to MBS trading at the moment: The majority of non-public MBS investors (everyone besides the Fed) are trading in coupons with expected duration less than 5 years. So even if consumer inflation heats up (from low levels) it shouldn't force MBS investors to consider the deteriorative (not a word) effects of inflation on the cash flows of shorter duration "up in coupon" MBS positions. In regards to your "rate sheet influential" MBS coupons the Fed is providing stability and mortgage bankers haven't been offering up much supply lately so....even if TSYs sell on hotter than expected inflation readings....MBS has the potential to remain insulated. Translation: MBS may sell but yield spreads should tighten and MBS will strengthen in terms of relative value.
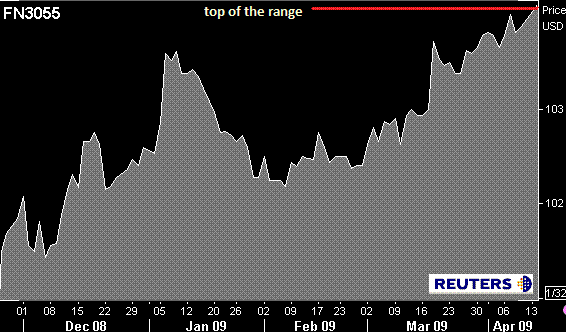
On the other hand...day trading MBS coupons are at the top of their trading range and MBS investors may use warm inflation data (or any reason) as an excuse to let the stack cheapen up a bit. See chart for illustration of "top of trading range"...
Short term range...

Longer term...

0830: April Empire State Manufacturing Index. Economist are expecting a reading of -35.00 after the March reading of -38.23. This is one of those reports I expect to be overshadowed.
0900: February Treasury International Capital Flows. Net foreign spending on US Treasury bonds. In January overseas accounts bought and sold a net of $10.74bn longer dated maturity US Treasury debt. If you are interested in reading more HERE is some info provided by Treasury.
0915: March Industrial Production/Capacity Utilization: Investors like this report because it has a reputation for reacting fairly fast to changes in the business cycle, so it has fairly accurate predictive abilities for manufacturing employment, average hourly earnings, and personal income. Capacity Utilization tells us what US industries are currently producing compared to what they could be producing if they were operating at maximum capacity. This data set has some forward looking value. It can help estimate business investment spending and also show signs of inflation to come. Forecasters are estimating continued contractions in March (-1.0%) following a February reading of -1.5%. Capacity Utilization has been estimated to read 69.6% following a February reading of 70.2%.
1300: April NAHB Index: this data set assesses the current market for new single family home sales and gives us an idea of builder expectations of the market for new homes in the future. Housing needs to play a big role in the recovery process so we will be paying close attention to any data regarding housing.
This release has set new record lows over the past few months...so anything better than a record low is great. Economists are expecting a reading of 10 (yes I said 10) after the March reading of 9 (yes I said 9). Again..anything is better than another record low. Perspective: the NAHB index is on a scale of 100 with 100 being the highest. You see what I mean by record low now? 9 last month!!!!!! 9 out of 100!!!!!
1400: Federal Reserve Beige Book: from the Federal Reserve's website: "this report is published eight times per year. Each Federal Reserve Bank gathers anecdotal information on current economic conditions in its District through reports from Bank and Branch directors and interviews with key business contacts, economists, market experts, and other sources. The Beige Book summarizes this information by District and sector. An overall summary of the twelve district reports is prepared by a designated Federal Reserve Bank on a rotating basis."
We are looking for any "glimmers of hope"...any sign that the pace of contraction is slowing will be taken positively by markets. Any signs of faster contraction and...well I dont know maybe markets just ignore? It really depends on forward looking information indicated...we know the past was bad...markets are looking for any signs of recovery at this point.
Its going to be a busy day and data releases have the potential to be easily overlooked in the event that stock trader's attention is diverted to an optimistically shiny object.....


