MBS bids MUCH IMPROVED TODAY....down in coupon!!!!
120 marks...
FN30_________________________________
FN 4.5 -------->>>> +0-13 to 101-01 from 100-18
FN 5.0 -------->>>> +0-08 to 102-08 from 102-00
FN 5.5 -------->>>> +0-05 to 102-27 from 102-22
FN 6.0 -------->>>> +0-02 to 103-14 from 103-12

Consensus Estimate: -650,000
Actual: -639,000
In the week ending Feb. 28, the advance figure for seasonally adjusted initial claims was 639,000, a decrease of 31,000 from the previous week's revised figure of 670,000.
The 4-week moving average was 641,750, an increase of 2,000 from the previous week's revised average of 639,750.
The advance seasonally adjusted insured unemployment rate was 3.8 percent for the week ending Feb. 21, unchanged from the prior week's unrevised rate of 3.8 percent.
The advance number for seasonally adjusted insured unemployment during the week ending Feb. 21 was 5,106,000, a decrease of 14,000 from the preceding week's revised level of 5,120,000.
The 4-week moving average was 5,011,000, an increase of 76,750 from the preceding week's revised average of 4,934,250.
The fiscal year-to-date average for seasonally adjusted insured unemployment for all programs is 4.501 million.
The labor market continues to deteriorate....housing programs wont be helpful if borrowers don't have jobs. Our hope rests on the shoulders of the Stimulus Package!!!

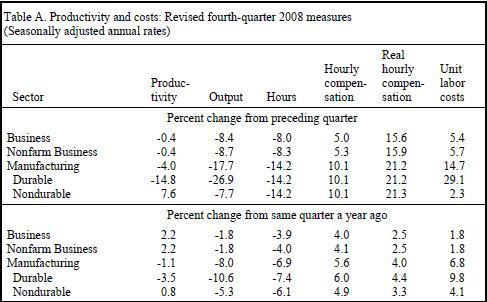
Productivity is the output that a worker produces for each hour of work. The more productive an employee the more they produce. A productive work force is essential if the economy is to grow faster and faster. It is even more important when firms are laying off labor...the remaining workers are relied upon to perform additional tasks. Plus labor costs make up about 70% of business expenses so if a company is not using their labor force effectively they could be wasting a lot of money!!!
PRODUCTIVITY REVISED SHARPLY FOR THE WORSE0....UNIT LABOR COST HIGHER THAN EXPECTED
Productivity growth for the fourth quarter of 2008 was revised down by 3.5 percentage points in the business sector and 3.6 percentage points in the nonfarm business sector from the estimates published February 5.
In both sectors output was revised down by 3.2 percentage points and hours were revised up by 0.1 percentage point. Productivity growth during calendar year 2008 was not revised in either sector.
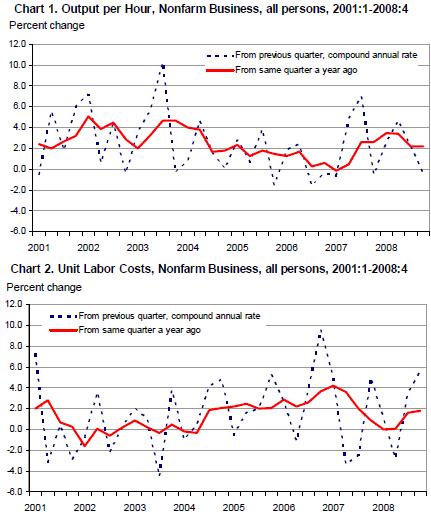
Productivity increased 2.2 percent during the last four quarters (chart 1)
Unit labor costs increased 5.7 percent in the fourth quarter and 1.8 percent over the last four quarters (chart 2). Hourly compensation grew 5.3 percent in the fourth quarter of 2008. Real hourly compensation rose steeply, 15.9 percent, when the 9.2 percent decrease in consumer prices was taken into account. This was the largest increase in the real hourly compensation series, which begins in the second quarter of 1947.
IMPORTANT: unit labor cost represents the cost of labor to produce a single unit of product. Labor is the biggest cost of production and these costs are either passed down to consumers or companies take losses on their P&L. We need labor costs to decrease as productivity increases. Fundamentally this data implies either inflation or worsening corporate profits.
Consensus: -3.5%
Actual: -1.9%
New orders for manufactured goods in January, down six consecutive months, decreased $6.9 billion or 1.9 percent to $351.9 billion. This was the longest streak of consecutive monthly decreases since the series was first published on a NAICS basis in 1992 and followed a 4.9 percent December decrease. Excluding transportation, new orders decreased 0.9 percent.
Shipments, also down six consecutive months, decreased $6.6 billion or 1.7 percent to $369.4 billion. This also was the longest streak of consecutive monthly decreases since the series was first published on a NAICS basis in 1992 and followed a 3.3 percent December decrease.
Unfilled orders, down four consecutive months, decreased $13.5 billion or 1.7 percent to $786.8 billion. This was the longest streak of consecutive monthly decreases since September 2002-January 2003 and was the largest percent decrease in unfilled orders since June 2002. This followed a 1.5 percent December decrease.
The unfilled orders-to-shipments ratio was 5.97, up from 5.85 in December. Inventories, down five consecutive months, decreased $4.4 billion or 0.8 percent to $537.6 billion. This also was the longest streak of consecutive monthly decreases since March 2003-January 2004 and followed a 1.9 percent December decrease.
The inventories-to-shipments ratio was 1.46, up from 1.44 in December.
This data is better than expected and improved from the December reading, but is still bad....manufacturing is in big trouble but this data and the ISM report that was released on Monday makes us question if the pace of contraction is starting to slow. Maybe....
Still to come: Bond Auction Announcements, Bankruptcy Judges, and Freddie Mac Survey


