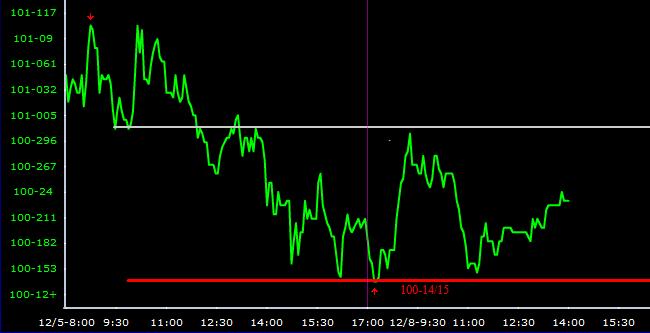
Above is a 2 day chart on Fannie Mae 5.0's. The grey line is 101-00 and the red line is between 100-14 and 100-15. You can see that on Friday when we fell below 101-00, we bounced off that ceiling twice as resistance and haven't regained that ground since.
This is significant for two reasons. First, there is always an implicit resistance level at or near the "round numbers" of MBS trading, escpecially 100-00 and 101-00. Some of this is due to actual flow considerations while some might be speculatively psychological. Whatever the case, it's common enough that we make a note of it. In this case, it also coincides with the 38% retracement level. In combination, that gives the 101-00 level a bit more credence than we otherwise might. As we've discussed in the past, the favorite "stopping points" for fibonacci speed lines tend to be 38 and 62. The fact that we rallied this AM and turned back at exactly this level gives it even more potency.
Now remember, we don't draw that line at 101-00 because it's "unbreakable." We draw it because WHEN it's broken and BY HOW MUCH will give us clues as to what might happen next. For now, it's a fairly stern level of overhead resistance until something more "governmental" comes along to buy buy buy. On the bright side, we have a fairly well established (both from recent hours and recent days) downside at 100-14/15. In a data vacuum (like that ever happens!), we'd expect this trading pattern to continue until a reasonably powerful force acts upon the curve. Smooth sailing for the rest of the day, but the price of YSP is eternal vigilance, so stay tuned!


