Yesterday
- Slowest day for bond markets in 2 months, especially for Treasuries
- MBS were more volatile and shed 3/8ths of a point from peak to trough before ending close to unchanged
- Rates started strong and also ended the day near unchanged vs Friday's latest levels
- Nothing much on tap by way of market movers.
Today
- As shutdown continues, market moving data remains in short supply
- Treasury Auctions begin, giving bond markets at least one thing to do.
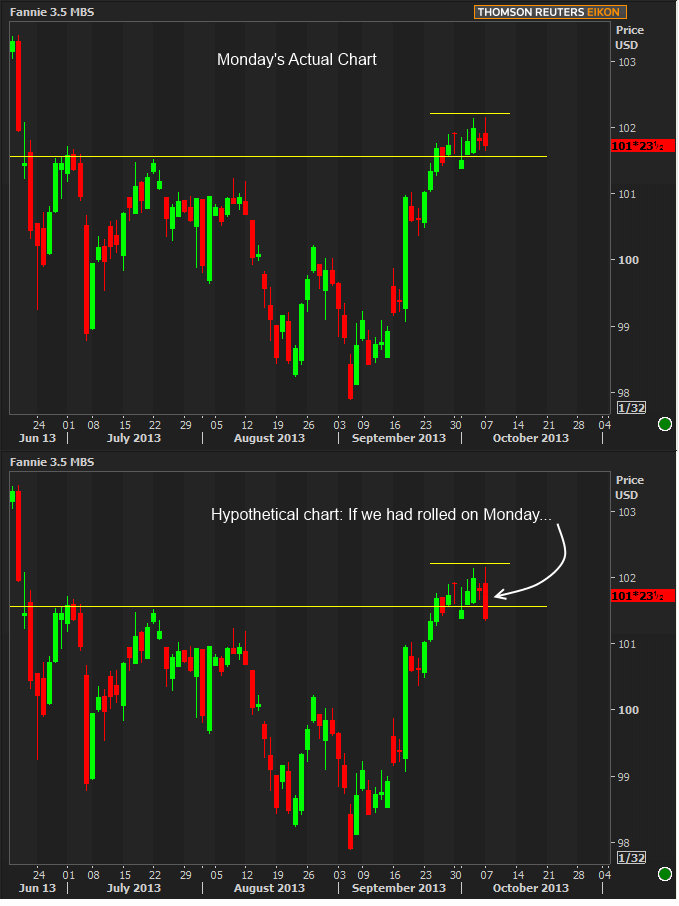
- Class A MBS (Fannie/Freddie 30yr Fixed) "roll" after the last trade today
- Class A prices will adjust to November coupons at the end of the day, roughly 10 ticks lower
Strategy
With the government shutdown ongoing, there continues to be a severe restriction on relevant economic data. Unfortunately, "relevant economic data" is exactly what financial markets would have been interested in last week and this week, making for a real quagmire of sideways indecision instead. Today's data would have included the Trade Deficit, but this isn't a big-time market mover anyway. That leaves us only with two Fed speakers and the 3yr Treasury note auction.
2 and 3yr auctions haven't offered much over the past two years. This became most abjectly true in August 2011 when the Fed introduced their "calendar verbiage" to the official policy statement. The short end of the yield curve tends to "hang out" in a certain proximity to Fed Funds and other shortest-term rates. With the Fed's policy effectively stapling Fed Funds to the floor for a guaranteed amount of time, 2's and 3's subsequently stapled themselves nearby, and auctions instantly became completely uneventful.
Now that the Fed Funds horizon is potentially closer than 2-3yrs in the future (i.e. the Fed is seen as raising rates in a few years), 2's and 3's have shown signs of life. Auctions haven't instantly become major market-moving events, but they have become something other than completely meaningless, even if only slightly. On a day with not much else going on, save for the hope of an unexpected headline or two, we'll take what we can get.
Charts
10yr Treasury yields, illustrating the recent range. While there have been several brief tests below the lower yellow line, it has been the most frequently visited low. It also gains some significance as being the lower edge of a major gap seen in early August. Gaps like this often become inflection points for future trading.

A "before and after" chart of the roll, based on the hypothetical premise of the roll happening yesterday. In other words, here's a visual example of the impact of the roll if it happened yesterday afternoon.

Note: the reports that would have been released this week are struck-through in this calendar.
|
Week Of Tue, Oct 7 2013 - Fri, Oct 11 2013 |
|||||
|
Time |
Event |
Period |
Unit |
Forecast |
Prior |
|
Mon, Oct 7 |
|||||
|
15:00 |
Consumer credit |
Aug |
bl |
11.55 |
10.44 |
|
Tue, Oct 8 |
|||||
|
|
|
|
|
|
|
|
13:00 |
3-Yr Note Auction |
-- |
bl |
30.0 |
-- |
|
Wed, Oct 9 |
|||||
|
07:00 |
MBA Mortgage market index |
w/e |
-- |
-- |
450.2 |
|
07:00 |
MBA 30-yr mortgage rate |
w/e |
% |
-- |
4.49 |
|
|
|
|
|
|
|
|
13:00 |
10yr Treasury Auction |
-- |
bl |
21.0 |
-- |
|
14:00 |
FOMC Minutes (Sept 17-18 meeting) |
|
|
|
|
|
Thu, Oct 10 |
|||||
|
|
|
|
|
|
|
|
|
|
|
|
|
|
|
|
|
|
|
|
|
|
08:30 |
Initial Jobless Claims |
w/e |
k |
310 |
308 |
|
13:00 |
30-Yr Treasury Auction |
-- |
bl |
13.0 |
-- |
|
Fri, Oct 11 |
|||||
|
|
|
|
|
|
|
|
|
|
|
|
|
|
|
09:55 |
Consumer Sentiment |
Oct |
-- |
76.0 |
77.5 |
|
10:00 |
Business inventories mm |
Aug |
% |
0.3 |
0.4 |


