The week got off to an interesting but pleasant start for bond markets with MBS ending the day 3/8ths of a point higher than Friday's close. Almost all of the movement came between 8:30 and 8:45am following weaker Durable Goods. Conditions were excessively quiet for Treasuries and MBS alike, and the fact that MBS originators were way more quiet than MBS buyers meant that MBS outperformed strongly in the AM hours (when more buying demand for MBS is typically seen).
The afternoon brought some trickiness, and it bears revisiting if for no other reason than to file away in our memory banks regarding the 3pm-4pm time frame. High-frequency-trading (HFT) vigilantes are quick to point out the aforementioned time frame as a prime target for HFT-related distortions in S&P Futures (the most visible and most actively-traded securities in the HFT arena). We've also already seen twitter-based algorithms run amok.
Putting 2 and 2 and 2 together, yesterday's big "geopolitical risk" news increasingly looks like an S&P-specific snowball that spilled over into other markets. There are similar moves in gold, oil, Yen, etc., but S&P was the first and the biggest by far. Bond markets are always happy to trade legitimate geopolitical risk and without commenting on whether or not Kerry's speech constituted such risk, we can see how Treasuries reacted and either infer no one's home or no one cares.

If anyone is home (and so far, it doesn't look like it), today should be incrementally more interesting for bond markets. The key data is Consumer Confidence at 10am though Case-Shiller Home Prices are out at 9am. Here's a look at Consumer Confidence and 10yr yields over time. This is one of the best examples of correlation lining up between yields in 10's and levels in the Confidence index (though the two continue to share peaks and valleys farther into the past).

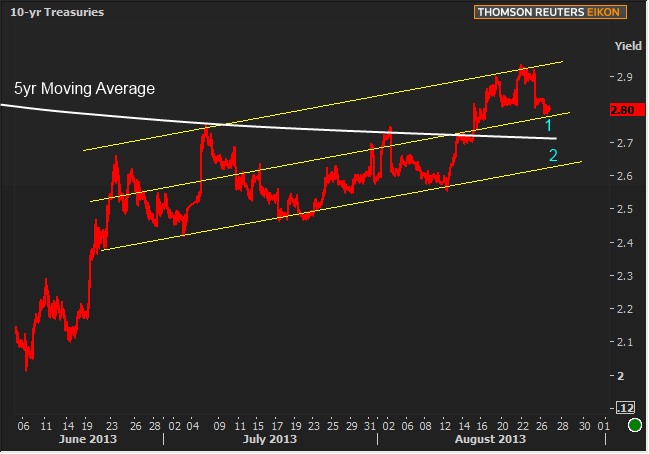
Any weakness in data will allow Treasuries to (hopefully) continue the consolidation that's been forming in the 2nd half of August after hitting recent multi-year highs. The 5-yr moving average is not something 10's have been keen to quickly break back below, though past examples are few and far between. Even so, the "1" zone in the chart below is a good tactical locking range for those who don't want to press their luck, hoping for more crummy data before next week's NFP. the "2" zone would be more aggressive.

Tactical locking opportunities depend heavily on how much MBS keep track with Treasuries. Fannie 4.0s have certainly been able to do a better job holding horizontal support levels compared to Treasuries and are already in the calmer part of their recent trend (upper half of the horizontal range below).

|
Week Of Mon, Aug 26 2013 - Fri, Aug 30 2013 |
|||||
|
Time |
Event |
Period |
Unit |
Forecast |
Prior |
|
Mon, Aug 26 |
|||||
|
08:30 |
Durable Goods |
Jul |
% |
-4.0 |
+3.9 |
|
Tue, Aug 27 |
|||||
|
09:00 |
Case-Shiller Home Prices |
Jun |
% |
1.0 |
1.0 |
|
10:00 |
Consumer confidence |
Aug |
-- |
79.0 |
80.3 |
|
13:00 |
2-Yr Note Auction |
-- |
bl |
34.0 |
-- |
|
Wed, Aug 28 |
|||||
|
07:00 |
MBA Mortgage market index |
w/e |
-- |
-- |
450.4 |
|
10:00 |
Pending sales change |
Jul |
% |
0.0 |
-0.4 |
|
13:00 |
5yr Treasury Auction |
-- |
bl |
35.0 |
-- |
|
Thu, Aug 29 |
|||||
|
08:30 |
Initial Jobless Claims |
w/e |
k |
330 |
336 |
|
08:30 |
GDP Preliminary |
Q2 |
% |
2.2 |
1.7 |
|
13:00 |
7-Yr Note Auction |
-- |
bl |
29.0 |
-- |
|
Fri, Aug 30 |
|||||
|
08:30 |
Personal Consumption Expenditures |
Jul |
% |
0.3 |
0.5 |
|
09:45 |
Chicago PMI |
Aug |
-- |
53.0 |
52.3 |
|
09:55 |
Consumer Sentiment |
Aug |
-- |
80.5 |
80.0 |
|
|
|||||


