I once read that if the title of an article is phrased in the form of a question that the answer is "no"--something to do with an author that's not capable of making a compelling enough point to prove something outright. But whoever forwarded that observation must not have been doing so with respect to financial markets, especially not right now when there are more questions than answers.
One question on the minds of a lot of the participants in the live discussion on MBS Live: "is there any validity to this Great Rotation discussion?" The Great Rotation is a broad topic that's easily misconstrued, but it has been around since late 2012. Long story short, there are two key elements on which to focus: shift from bonds to stocks or shift from 30yr-long bond rally to 'something else.'
The fact that money has been flowing out of bonds and into stocks in 2013 is already apparent. Bond funds continue to report huge outflows while equities funds report inflows. The other element--the one where interest rates may be turning a generational corner--is less easy to observe and declare true or false. We really only have 1 year of trending higher in rates from mid 2012 all-time lows. We'd need to at least surpass the 3 year trend higher from 2003-2006 in order to truly pass judgment.
Why all the rotation discussion today? It has to do with the following chart:
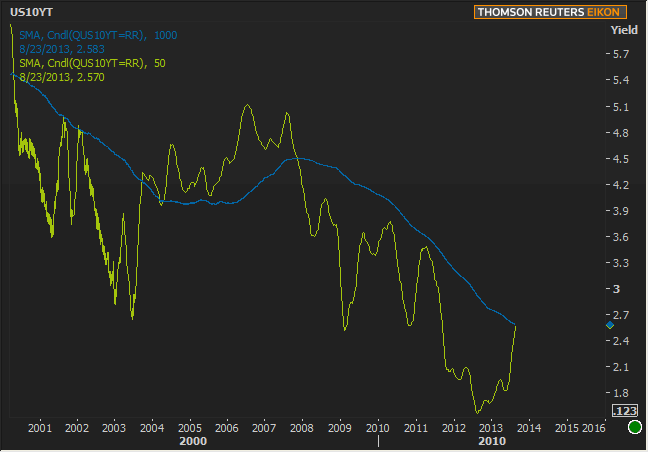
What we're looking at here is a 50 day moving average of the 10yr Treasury yield vs a 1000 day moving average. On any other day, this is just one of the dozens of charts I flip through, but it caught my eye recently as the 50 day line approached the 1000 day line.
Given that I don't put much stock in moving averages as predictive tools, I didn't know exactly why it caught my eye without thinking about it for a moment. My best guess is that it had to do with the day 2001 and 2002 saw strikingly perfect bounces. Yields kept falling. Then we had a big sell-off in 2003, very similar to the one we're having now.
Then look at what happens after the sell-off breaks the 1000-day moving average. Yields don't reverse, but they definitely calm down and trend steadily higher. And that was my original thesis: I can't imagine that the economy could survive yields that continue to rise at the same pace they have been. If we were to rise another point in the next 3 months, the game would certainly be over and no one would win. I rarely make predictions but another point in 3 months isn't happening.
What COULD happen (if everything goes as well as it can for the economy) is that--at some point in the next few months--yields would move higher at a much gentler pace. It's very likely the case that we were looking at the end of the generational rally in Treasuries back in 2003, and then the Great Recession killed that buzz (and look at where the green line breaks back below blue in the chart above! Right when the recession began).
After all that thinking, I decided to check the longer term history of these two moving averages before I told you all this, and the results were interesting.
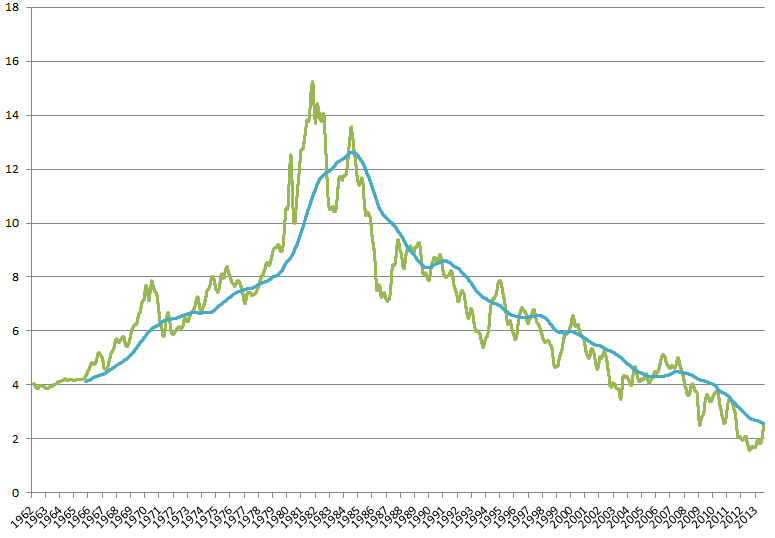
As is so often the case, trends that look awesome during one period of time, stand a higher and higher chance of losing their awesomeness the more historical data is included. There are still a few conclusions to be drawn though.
The most important conclusion is that we only have two instances in modern economic history of the green line rising quickly to break the blue line after an extended separation--1994 and 1999. In both cases, there was clearly an extra few months of overrun that carried yields even higher. This is likely a scenario that would play out again if next week's data is solid and if Sep 6th NFP is strong, and it's just a possibility to be aware of.
That said, neither of those past examples turned out to be any sort of Great Rotation--not even close. The closest thing we've seen in our lifetimes is the 2003 move. Bottom line: if we don't get a big bounce lower, at least we get a gentler slope sideways higher, and if we don't get that gentler slope, chances increase for a big bounce lower.
Sorry, this wasn't much of a "Day Ahead" post, but rather a super long term look at "maybes." New Home Sales are out today at 10am. Other than that, tradeflows and technicals dictate the pace. Rate snowballs in either direction are possible, but my fingers are crossed for downhill between now and NFP. Conventional wisdom would seem to suggest rates should be defensive ahead of big data that could damage them more, but the charts show the next 6 sessions as the best opportunity for another consolidation before the next more sharply directional move.
|
Week Of Mon, Aug 20 2013 - Fri, Aug 24 2013 |
|||||
|
Time |
Event |
Period |
Unit |
Forecast |
Prior |
|
Tue, Aug 20 |
|||||
|
08:30 |
National Activity Index |
Jul |
-- |
-- |
-0.13 |
|
Wed, Aug 21 |
|||||
|
07:00 |
Mortgage market index |
w/e |
-- |
-- |
471.9 |
|
07:00 |
MBA 30-yr mortgage rate |
w/e |
% |
-- |
4.56 |
|
10:00 |
Existing home sales |
Jul |
ml |
5.16 |
5.08 |
|
14:00 |
FOMC Minutes (Jul 31st Meeting) |
-- |
-- |
-- |
-- |
|
Thu, Aug 22 |
|||||
|
08:30 |
Initial Jobless Claims |
w/e |
k |
330 |
320 |
|
09:00 |
Monthly Home Price yy |
Jun |
% |
-- |
7.3 |
|
09:00 |
Monthly Home Price mm |
Jun |
% |
-- |
0.7 |
|
13:00 |
5yr TIPS Auction |
-- |
bl |
16.0 |
-- |
|
Fri, Aug 23 |
|||||
|
10:00 |
New home sales chg mm |
Jul |
% |
-- |
8.3 |
|
10:00 |
New home sales-units mm |
Jul |
ml |
0.485 |
0.497 |
|
* mm: monthly | yy: annual | qq: quarterly | "w/e" in "period" column indicates a weekly report * Q1: First Quarter | Adv: Advance Release | Pre: Preliminary Release | Fin: Final Release * (n)SA: (non) Seasonally Adjusted * PMI: "Purchasing Managers Index" |
|||||


