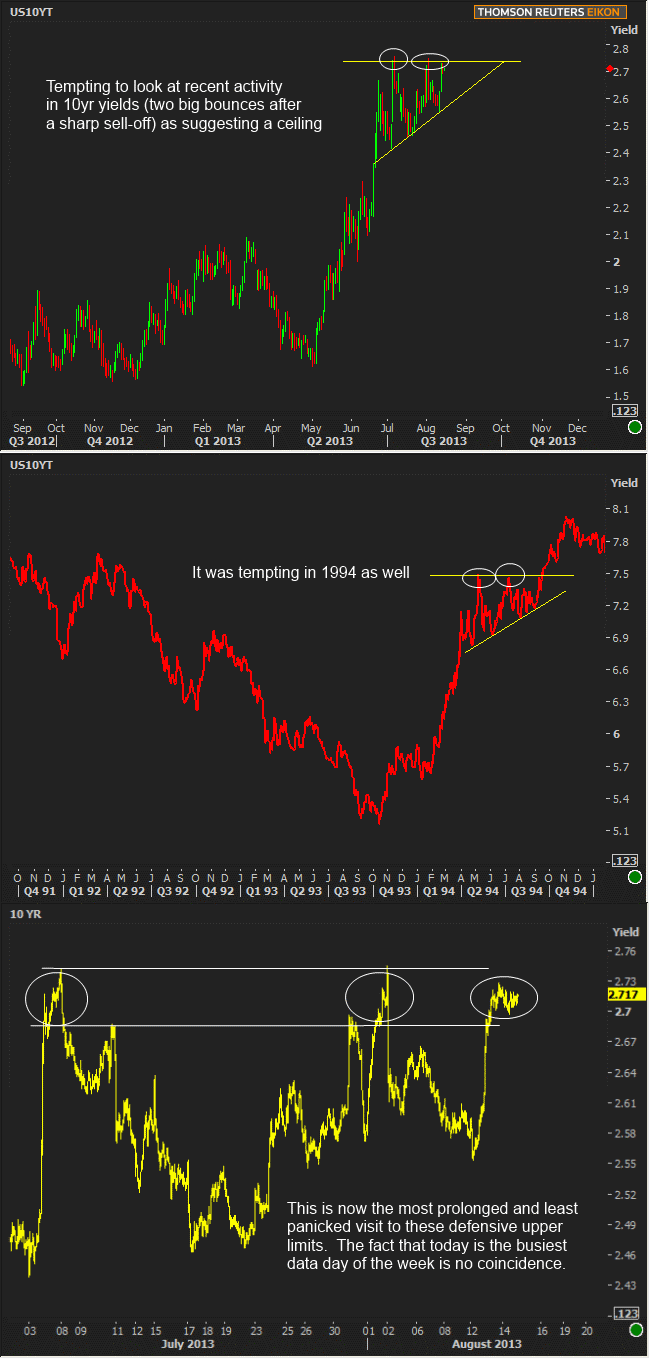
So far this week, Monday has shown us that bond markets were considering getting back in the swing of things after a dull week past. Tuesday confirmed it. Wednesday suggested that the focus is on Economic data (as an absence of it left Treasuries and MBS sideways), and now today provides an opportunity to find out with the most robust calendar of data offerings this week. Even if the data arrive in just such a way as to leave levels unchanged by the end of the day, we should still be able to see a noticeable activity between the open and close.
Even though the earliest possible announcement for Fed tapering is over a month away, the consensus will be firmed up between then and now, having potentially big effects on rates even before the announcement itself. The biggest piece of information will naturally be the Employment Situation Report at the beginning of September. Today is relevant not only because it brings a rather impressive glut of moderately important economic data, but also because it coincides with rates having their backs against the wall--or ceiling, as the case may be.

In other words, this is our third visit above 2.70%. It's the only time we've closed over 2.70 twice in a row. Unlike the previous two instances, there was no volatility once 2.7 was broken. Finally, the previous two instances coincided with NFP releases (one on the day of, the other on the day before). This either makes 2.73-ish one hell of a ceiling or it means that rates are seriously considering a break higher if the data justifies it.
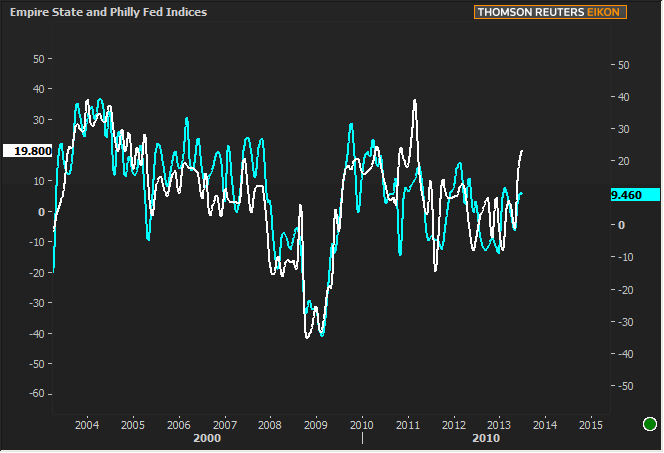
Today's reports include CPI, Empire State Manufacturing, Jobless Claims, Industrial Production, Philly Fed, and NAHB. Of those, the first three hit at 8:30 with Claims and Empire State being the punchiest. Later in the morning, the 'most-punchy' title goes to Philly Fed. The trading considerations are made all the more interesting by the historically strong correlation between that and Empire State. If Empire State surprises, we could see preemptive bets being placed that Philly Fed will as well.

|
Week Of Mon, Aug 12 2013 - Fri, Aug 16 2013 |
|||||
|
Time |
Event |
Period |
Unit |
Forecast |
Prior |
|
Mon, Aug 12 |
|||||
|
14:00 |
Federal budget, $ |
Jul |
bl |
-96.0 |
116.5 |
|
Tue, Aug 13 |
|||||
|
08:30 |
Import prices mm |
Jul |
% |
0.8 |
-0.2 |
|
08:30 |
Retail sales ex-autos mm |
Jul |
% |
0.4 |
0.0 |
|
08:30 |
Retail sales mm |
Jul |
% |
0.3 |
0.4 |
|
08:30 |
Export prices mm |
Jul |
% |
0.2 |
-0.1 |
|
10:00 |
Business inventories mm |
Jun |
% |
0.3 |
0.1 |
|
Wed, Aug 14 |
|||||
|
07:00 |
MBA Mortgage market index |
w/e |
-- |
-- |
495.4 |
|
08:30 |
Producer prices mm |
Jul |
% |
0.3 |
0.8 |
|
08:30 |
Producer prices, core mm |
Jul |
% |
0.2 |
0.2 |
|
Thu, Aug 15 |
|||||
|
08:30 |
Core CPI mm, sa |
Jul |
% |
0.2 |
0.2 |
|
08:30 |
Initial Jobless Claims |
w/e |
k |
335 |
333 |
|
08:30 |
NY Fed manufacturing |
Aug |
-- |
10.00 |
9.46 |
|
09:15 |
Industrial output mm |
Jul |
% |
0.3 |
0.3 |
|
09:15 |
Capacity utilization mm |
Jul |
% |
78.0 |
77.8 |
|
10:00 |
Philly Fed Business Index |
Aug |
-- |
15.0 |
19.8 |
|
10:00 |
NAHB housing market indx |
Aug |
-- |
57 |
57 |
|
Fri, Aug 16 |
|||||
|
08:30 |
Housing starts number mm |
Jul |
ml |
0.910 |
0.836 |
|
08:30 |
Labor costs Revised |
Q2 |
% |
1.0 |
-4.3 |
|
08:30 |
Building permits: number |
Jul |
ml |
0.935 |
0.918 |
|
08:30 |
Productivity Revised |
Q2 |
% |
0.6 |
0.5 |
|
09:55 |
U.Mich sentiment |
Aug |
-- |
85.5 |
85.1 |
|
* mm: monthly | yy: annual | qq: quarterly | "w/e" in "period" column indicates a weekly report * Q1: First Quarter | Adv: Advance Release | Pre: Preliminary Release | Fin: Final Release * (n)SA: (non) Seasonally Adjusted * PMI: "Purchasing Managers Index" |
|||||


