Yesterday's sell-off was a bit of wake-up call for anyone lulled into a false sense of security by last week's tepidity or their crystal ball's turbidity. To be fair to last week, it never existed. That is to say, it stuck out like a sore thumb as a week without purpose for several reasons and markets traded it accordingly. No commitment was made to either side of the recent trading ranges and volume was excruciatingly low.
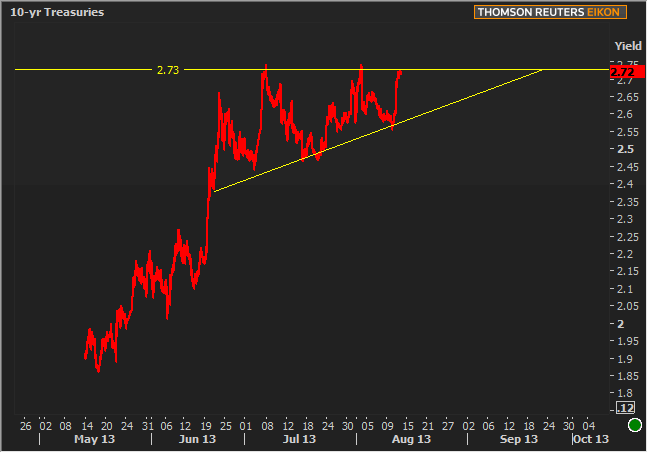
That said, this week remained something of a wild card in terms of how much it would do to reverse the trend of nonexistence and insignificance instilled by its predecessor. At the very least, we can see that it exists! Volume was high and the movement was abrupt, but was it significant? Look at the following chart of 10yr yields (yesterday is the straight line up at the end), and decide for yourself:

Granted, the overlaid lines might make for a less than unbiased conclusion, but to be fair to the lines, they're objectively placed to contain 99% of the movement since the big June 19th Fed Announcement. Now consider that those moments in time where the lower line is being tested are moments where nothing much is happening compared to the moments where the upper line is being tested (just after NFP, just before NFP, and just after Retail Sales). The lower line almost doesn't matter and we're left with the rather stark picture of a 10yr yield that's gravitating toward 2.75 in an increasingly narrow range. Naturally the collision of the trends is right on September's FOMC week (naturally!).
Ostensible gravitas aside, it's all about the data now. The Fed will taper and no one is 100% sure when. There are plenty in the September camp and too many to be ignored in the December camp. As has been and will continue to be the case, the data will simply act to push the consensus back and forth between these sections of the calendar. What's not yet clear is whether or not this 2.75%-ish ceiling seen in 10yr yields is more of a true ceiling that fully (or mostly) prices in a September taper (has the TV started talking about "Sept-taper?") or if 2.75 is just the mid point from which a "yes" vote in September results in 3% while "no" points toward 2.5. Thus far, it looks like we're trending up toward the latter option, and simply have yet to break 2.75.
Either way, we'll know more about how this will shape up when we get more meaningful data. Unfortunately, that will have to wait until Thursday as nothing too serious prints today. MBA application data in the morning is interesting, but not market moving. Similarly, the Producer Price Index at 8:30am may have a token effect, but isn't the first place the Fed will be looking to confirm or reject any of their inflation assumptions.
|
Week Of Mon, Aug 12 2013 - Fri, Aug 16 2013 |
|||||
|
Time |
Event |
Period |
Unit |
Forecast |
Prior |
|
Mon, Aug 12 |
|||||
|
14:00 |
Federal budget, $ |
Jul |
bl |
-96.0 |
116.5 |
|
Tue, Aug 13 |
|||||
|
08:30 |
Import prices mm |
Jul |
% |
0.8 |
-0.2 |
|
08:30 |
Retail sales ex-autos mm |
Jul |
% |
0.4 |
0.0 |
|
08:30 |
Retail sales mm |
Jul |
% |
0.3 |
0.4 |
|
08:30 |
Export prices mm |
Jul |
% |
0.2 |
-0.1 |
|
10:00 |
Business inventories mm |
Jun |
% |
0.3 |
0.1 |
|
Wed, Aug 14 |
|||||
|
07:00 |
MBA Mortgage market index |
w/e |
-- |
-- |
495.4 |
|
08:30 |
Producer prices mm |
Jul |
% |
0.3 |
0.8 |
|
08:30 |
Producer prices, core mm |
Jul |
% |
0.2 |
0.2 |
|
Thu, Aug 15 |
|||||
|
08:30 |
Core CPI mm, sa |
Jul |
% |
0.2 |
0.2 |
|
08:30 |
Initial Jobless Claims |
w/e |
k |
335 |
333 |
|
08:30 |
NY Fed manufacturing |
Aug |
-- |
10.00 |
9.46 |
|
09:15 |
Industrial output mm |
Jul |
% |
0.3 |
0.3 |
|
09:15 |
Capacity utilization mm |
Jul |
% |
78.0 |
77.8 |
|
10:00 |
Philly Fed Business Index |
Aug |
-- |
15.0 |
19.8 |
|
10:00 |
NAHB housing market indx |
Aug |
-- |
57 |
57 |
|
Fri, Aug 16 |
|||||
|
08:30 |
Housing starts number mm |
Jul |
ml |
0.910 |
0.836 |
|
08:30 |
Labor costs Revised |
Q2 |
% |
1.0 |
-4.3 |
|
08:30 |
Building permits: number |
Jul |
ml |
0.935 |
0.918 |
|
08:30 |
Productivity Revised |
Q2 |
% |
0.6 |
0.5 |
|
09:55 |
U.Mich sentiment |
Aug |
-- |
85.5 |
85.1 |
|
* mm: monthly | yy: annual | qq: quarterly | "w/e" in "period" column indicates a weekly report * Q1: First Quarter | Adv: Advance Release | Pre: Preliminary Release | Fin: Final Release * (n)SA: (non) Seasonally Adjusted * PMI: "Purchasing Managers Index" |
|||||


