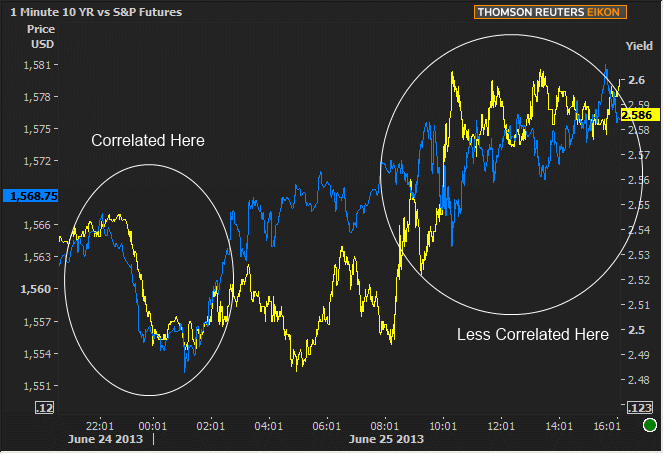
The shape of the charts yesterday is a dead giveaway on the extent to which markets continue to be hung up about the "QE on/off" trade. While the overnight action showed the more traditional connection between equities and Treasuries, the domestic hours were back to their old ways, where "old" = past few weeks. In other words, even when looking at long term charts and observing the divergence between bond yields and stock prices (where both were more typically improving since 2009), there were still intraday correlations between yields and prices.
The polar opposite has been almost exclusively the case during domestic hours of late, and yesterday is no exception. What is interesting, however, is to see that both sides of the market clearly reacted to the 10am Consumer Confidence data. Whereas Treasuries did what you'd expect, stocks lost ground, essentially flying in the face of the notion that QE prospects shouldn't affect equities. Note just how perfectly the two lines begin bouncing away from each other during the domestic session! This is CLEARLY a market that is fully committed to running with the herd, toward or away from QE, either due to fear, indecision, strategy, or a combination of the three.
That makes GDP data interesting to whatever extent it manages to break from the preliminary reading of 2.4%. The prospects for big breaks from Advance to Preliminary to Final readings are pretty slim, but not unheard of. If there's a big enough break, it could supersede the fact that the data is mostly a collection of "stuff' that's already known AND the fact that it's stale (Q1 is a long time ago), if for not other reason than Bernanke mentions Fed Forecasts as an ongoing informant in the case against QE and that GDP is one of those data points. Once again, the conclusion here is: unlikely to deviate much, but if it does, it's a big deal.
Finally, there's the 5yr note auction at 1pm. Keep in mind that 5's are the next most heavily traded of the coupons that are relevant to MBS markets after 10's. Also keep in mind that 5's are currently a closer duration-matched benchmark. What does that mean? Simply that part of the way investors look at the value of MBS is against a vanilla yardstick of similar duration. When the average mortgage lasts 7+ years, 10yr Treasuries are a solid bet. When the life expectancy of the average mortgage falls under 7yrs, 5yr Treasuries become more interesting. Why not 7yr Treasuries? Repeat after me: no one cares about 7yr Treasuries (seriously though, there's no volume there and not even a futures market for 7's. They're more of an obligatory space filler and they may not be around forever. Too flighty for MBS to compare themselves to).
You'd be well within your right to wonder "if rates are moving higher, won't mortgages live longer as few people refi?" and you'd be absolutely right. But the longevity assumptions about the current crop of interest rates still places them slightly closer to 5yrs than 10yrs in terms of life expectancy (well, rates of 4.375-4.875 that end up in Fannie 4.0 buckets are closer to 5yrs while anything lower is much closer to 10yrs). Whatever the case, the point is "5's matter more than they used to when new MBS production was hovering between 3.0 and 2.5 coupons." Does this mean that the auction will be a big market mover? Not necessarily, but it does mean that if it motivates significant movement, MBS will feel it. More importantly, in and of themselves, 5's have been hit extra hard by the QE trade and the auction may offer clues about the evolving shape of the yield curve (that's a fancy way of saying that 5yr auction results have greater-than-normal potential to act as a market mover in general). Here's how badly they've been hit compared to 10s (highs and lows were lined up through 5/22 to show the effects post FOMC Minutes):

|
Week Of Mon, Jun 23 2013 - Fri, Jun 27 2013 |
|||||
|
Time |
Event |
Period |
Unit |
Forecast |
Prior |
|
Mon, Jun 24 |
|||||
|
08:30 |
National Activity Index |
May |
-- |
-- |
-0.53 |
|
Tue, Jun 25 |
|||||
|
08:30 |
Durable Goods |
May |
% |
3.0 |
3.5 |
|
09:00 |
FHFA Home Price mm |
Apr |
% |
-- |
1.3 |
|
09:00 |
Case Shiller Home Prices |
Apr |
% |
1.2 |
1.4 |
|
10:00 |
New home sales-units mm |
May |
ml |
0.463 |
0.454 |
|
10:00 |
Consumer confidence |
Jun |
-- |
75.5 |
76.2 |
|
13:00 |
2-Yr Note Auction |
-- |
bl |
35.0 |
-- |
|
Wed, Jun 26 |
|||||
|
07:00 |
MBA Mortgage market index |
w/e |
-- |
-- |
648.9 |
|
07:00 |
MBA 30-yr mortgage rate |
w/e |
% |
-- |
4.17 |
|
08:30 |
GDP Final |
Q1 |
% |
2.4 |
2.4 |
|
08:30 |
GDP deflator Final |
Q1 |
% |
1.1 |
1.2 |
|
13:00 |
5yr Treasury Auction |
-- |
bl |
35.0 |
-- |
|
Thu, Jun 27 |
|||||
|
08:30 |
Midwest manufacturing |
May |
-- |
-- |
95.9 |
|
08:30 |
Personal income mm |
May |
% |
0.2 |
0.0 |
|
08:30 |
Consumption, adjusted mm |
May |
% |
0.3 |
-0.2 |
|
10:00 |
Pending sales change mm |
May |
% |
0.9 |
0.3 |
|
13:00 |
7-Yr Note Auction |
-- |
bl |
29.0 |
-- |
|
Fri, Jun 28 |
|||||
|
09:45 |
Chicago PMI |
Jun |
-- |
56.0 |
58.7 |
|
09:55 |
U.Mich sentiment |
Jun |
-- |
82.7 |
82.7 |
|
* mm: monthly | yy: annual | qq: quarterly | "w/e" in "period" column indicates a weekly report * Q1: First Quarter | Adv: Advance Release | Pre: Preliminary Release | Fin: Final Release * (n)SA: (non) Seasonally Adjusted * PMI: "Purchasing Managers Index" |
|||||


