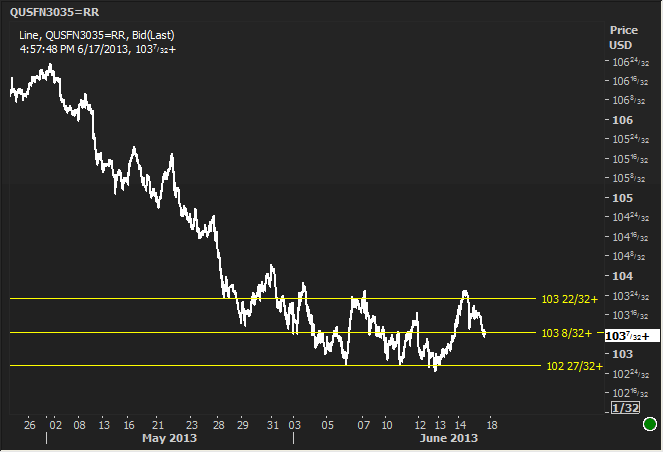
It would be nigh on impossible for anything that happens today to serve as a mere appetizer to Wednesday's main course: the FOMC Announcement, Economic Projections and Bernanke Press Conference. As we saw on Monday, that doesn't mean that markets are immune from movement. In the grand scheme, however, not only were Monday's moves rather small, but the whole fixed income universe has been asymptotically approaching some sort of shaky equilibrium for several weeks now in preparation. Here's the MBS version:

The implication is that Wednesday could easily break the upper or lower line, whereas today would be hard pressed to challenge either. The only pieces of economic data on the calendar are Consumer Prices and Housing Starts at 8:30am. Of the two, Housing Starts typically move markets more (because that report is actually a market mover whereas CPI hasn't been for more than 2 years). But this time around, each report bucks its own trend in a clever way.'
Housing Starts (which includes the more statistically even-keeled "Building Permits") is potentially interesting as a component of the Fed's dialogue on asset purchases. Sounds crazy, right? But keep in mind that several Fed governors in the past month have pointed out some measure of frothiness in housing ("froth" is some sort of less threatening way of saying "mini-bubbles" perhaps? Shall we go for "foaminess" instead?), and this has been leaned-on as justification for easing off the throttle on MBS purchases first and foremost. It's a bit of a stretch to think today's report will have any material impact on the FOMC Meeting (which begins today), but it may enter into the discussion if it looks foamy enough.
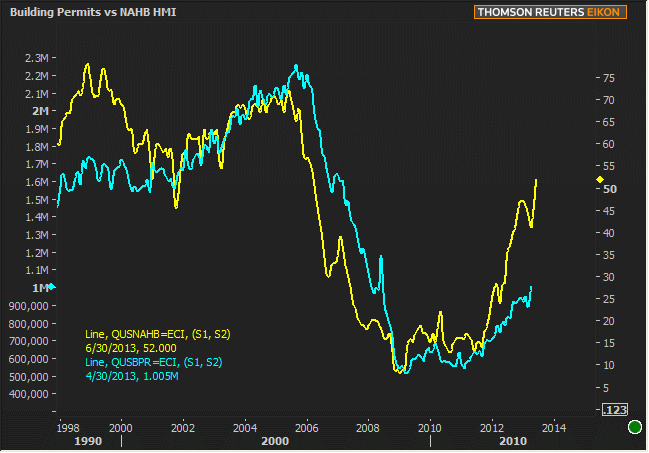
And for reasonable suspicions as to WHY it might look foamy, frothy, or pre-bubbly to some, look no further than yesterday's NAHB Housing Market Index, seen in the chart below as a reasonable front-runner of Building Permits. Incidentally, note that this chart, in and of itself, pops quite a few bubbly notions considering the 1 million permits level felt like a really nasty crash in early 2008. Yeah, we're almost back to those levels. Even then, it could be argued that more supply in a rising rate environment does more to work against a bubble than to build a case for one.

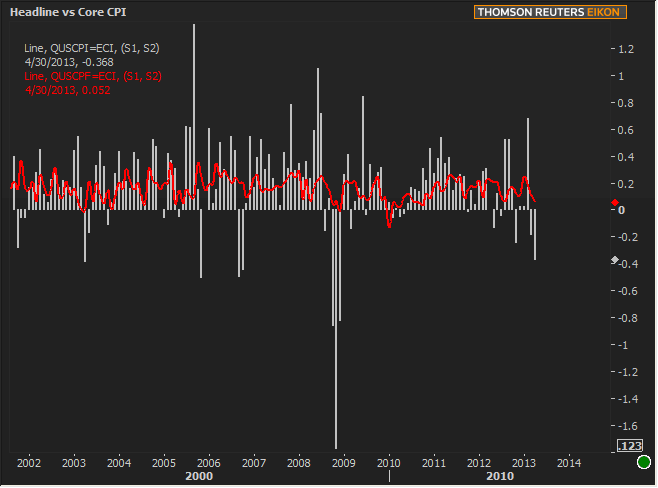
CPI is potentially more interesting than usual considering we've had the highest concentration of negative headline prints in the past year since the crisis, and a rare back-to-back negative print as of last month. The disclaimer is that CPI is only interesting if the headline is negative and/or Core is close. Otherwise, we might as well be looking at 2002-2004 as far as this report is concerned (in other words, CPI itself, doesn't suggest rampant deflationary panic just yet).

|
Week Of Mon, Jun 17 2013 - Fri, Jun 21 2013 |
|||||
|
Time |
Event |
Period |
Unit |
Forecast |
Prior |
|
Mon, Jun 17 |
|||||
|
08:30 |
NY Fed manufacturing |
Jun |
-- |
-0.50 |
-1.43 |
|
10:00 |
NAHB housing market indx |
Jun |
-- |
45 |
44 |
|
Tue, Jun 18 |
|||||
|
08:30 |
Housing starts number mm |
May |
ml |
0.924 |
0.853 |
|
08:30 |
Building permits: number |
May |
ml |
0.980 |
1.005 |
|
08:30 |
CPI mm, sa |
May |
% |
0.1 |
-0.4 |
|
08:30 |
Core CPI mm, sa |
May |
% |
0.2 |
0.1 |
|
08:30 |
Core CPI yy, nsa |
May |
% |
1.7 |
1.7 |
|
Wed, Jun 19 |
|||||
|
07:00 |
Mortgage market index |
w/e |
-- |
-- |
670.7 |
|
07:00 |
MBA 30-yr mortgage rate |
w/e |
% |
-- |
4.15 |
|
14:00 |
FOMC Announcement |
n/a |
% |
-- |
0.25 |
|
14:00 |
FOMC Forecasts |
n/a |
-- |
-- |
-- |
|
14:30 |
Bernanke Press Conference |
n/a |
-- |
-- |
-- |
|
Thu, Jun 20 |
|||||
|
08:30 |
Initial Jobless Claims |
w/e |
k |
340 |
334 |
|
08:58 |
Markit PMI |
Jun |
-- |
52.8 |
52.3 |
|
10:00 |
Existing home sales |
May |
ml |
5.01 |
4.97 |
|
10:00 |
Philly Fed Business Index |
Jun |
-- |
-0.2 |
-5.2 |
|
13:00 |
30-Yr TIPS auction |
-- |
bl |
7.0 |
-- |
|
* mm: monthly | yy: annual | qq: quarterly | "w/e" in "period" column indicates a weekly report * Q1: First Quarter | Adv: Advance Release | Pre: Preliminary Release | Fin: Final Release * (n)SA: (non) Seasonally Adjusted * PMI: "Purchasing Managers Index" |
|||||


