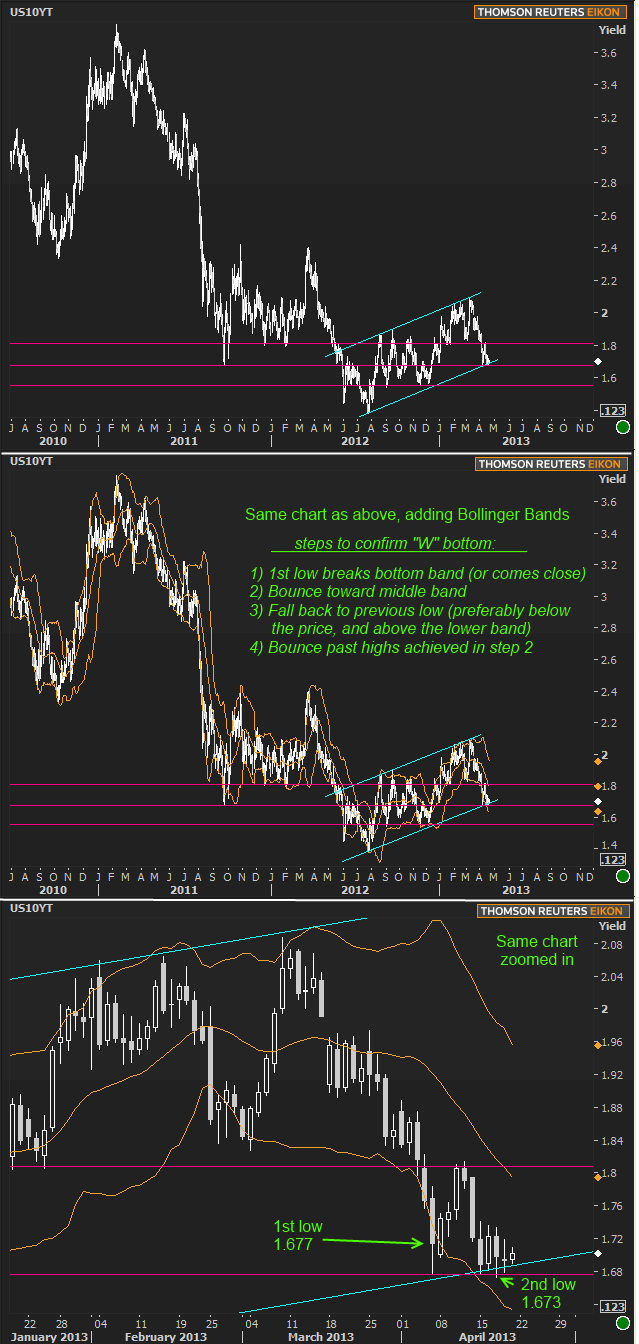
Although Friday's economic calendar is utterly empty, we're getting closer and closer to a time when decisions must be made as far as the trading momentum that leads up to month-end, FOMC and NFP one week after next. Friday's like today have seen their fair share of simply serving as an escape tunnel into the weekend, with no major stance taking shape. On the other hand, they've also played host to increased volatility where an absence of data and impending sense of grandeur leaves man and machine to react purely to other tradeflows and technical levels. It's this second scenario--or rather, the possibility of it--that makes today full of potential. It's not the higher probability scenario, but as we noted in yesterday morning's commentary, the next move outside this week's range will likely follow through to one of the next major pivot points.
Those major pivot points are the higher and lower horizontal lines in the chart below, seen in a carefully selected shade of magenta. They're roughly at 1.81 and 1.55, though the latter is admittedly an aggressive level that relies on month-end events to cooperate to bullish effect. 1.81, on the other hand, has a lot of precedent in the recent and not so recent past. It feels like it would take a lot less bearishness to move there than it would take bullishness to move to 1.55. As of Thursday night, we're essentially half way between, but unable to crack past that halfway mark all week, despite lots of attempts.
Those failed attempts in and of themselves are somewhat frustrating from a technical standpoint, but they're countered by the fact that bond markets have had a more bullish tilt overall (the lows may be flat, but the highs have been getting lower and lower. You can see more of this in the 3rd section of the triptych below). Technically speaking, that tilt is a "descending triangle" in terms of 10yr yields, and this market has almost convinced us that it's a mere byproduct of rediscovered bullishness. So to preserve some balance heading into the weekend (and especially if today happens to move higher in yield), here's a Bollinger Band chart. Actually, it's a triptych, first showing the same long term chart as yesterday, then overlaying the Bollinger Bands, and finally zooming in to assess their adherence to the guideposts of the infamous "W" bottom.

(read more about Bbands HERE)
Naturally, we have yet to confirm that 4th step of bouncing past the previous high at 1.814. The horizontal resistance right in the 1.67's is one wall that would need to break to prevent that from happening, but even more certainly, the longer term uptrend would need to break (teal line), something it has yet to definitively do. If there's been a reason to hold on to any defensiveness into this week's sideways slide, the fear of such a bounce would be it (naturally, we'd have to extrapolate 10yr Treasury movement to MBS, which don't lend themselves as well to technical studies due to the hiccups created by monthly settlement, but the implications is always the same when it comes to moves of this potential size, and in this case, that would mean Fannie 3.0s back in the mid 103's at best).
|
Week Of Mon, Apr 15 2013 - Fri, Apr 19 2013 |
|||||
|
Time |
Event |
Period |
Unit |
Forecast |
Prior |
|
Mon, Apr 15 |
|||||
|
08:30 |
NY Fed manufacturing |
Apr |
-- |
7.0 |
9.24 |
|
09:00 |
Net L-T flows,exswaps |
Feb |
bl |
40.0 |
25.7 |
|
10:00 |
NAHB housing market indx |
Apr |
-- |
45 |
44 |
|
Tue, Apr 16 |
|||||
|
08:30 |
CPI mm, sa |
Mar |
% |
0.0 |
0.7 |
|
08:30 |
Core CPI mm, sa |
Mar |
% |
0.2 |
0.2 |
|
08:30 |
Housing starts number mm |
Mar |
ml |
0.930 |
0.917 |
|
08:30 |
Building permits: number |
Mar |
ml |
0.940 |
0.939 |
|
09:15 |
Industrial output mm |
Mar |
% |
0.3 |
0.8 |
|
09:15 |
Capacity utilization mm |
Mar |
% |
78.4 |
78.3 |
|
Wed, Apr 17 |
|||||
|
07:00 |
Mortgage market index |
w/e |
-- |
-- |
826.1 |
|
07:00 |
Mortgage refinance index |
w/e |
-- |
-- |
4453.9 |
|
07:00 |
MBA Purchase Index |
w/e |
-- |
-- |
209.7 |
|
07:00 |
MBA 30-yr mortgage rate |
w/e |
% |
-- |
3.68 |
|
Thu, Apr 18 |
|||||
|
08:30 |
Initial Jobless Claims |
w/e |
K |
350 |
346 |
|
10:00 |
Philly Fed Business Index |
Apr |
-- |
3.0 |
2.0 |
|
13:00 |
5yr Treasury Auction |
-- |
bl |
18.0 |
-- |
|
* mm: monthly | yy: annual | qq: quarterly | "w/e" in "period" column indicates a weekly report * Q1: First Quarter | Adv: Advance Release | Pre: Preliminary Release | Fin: Final Release * (n)SA: (non) Seasonally Adjusted * PMI: "Purchasing Managers Index" |
|||||


