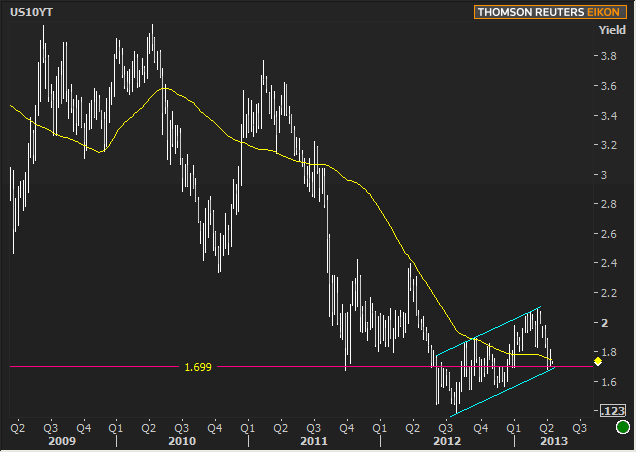
There's no question that the past three weeks of trading for domestic bond markets have been their best 3 week stretch of the year. This was exclusively a factor of only two of those weeks, with the most recent example actually acting as somewhat of a drag on the trend. It's this "drag" effect that we're primarily concerned with on this relatively data-free and event-free week.
It's not like there's nothing going on per se, but the pace of economic reports is light. European headline potential is muted (largely because Italian politics continue to be on hold) and the domestic calendar relies mainly on Earnings and one day of moderately relevant data to get its kicks. If we don't end up seeing one of those inexplicably apathetic weeks--the kind that don't beg to be considered significant--we may get a great look at the state of technical support/resistance levels. Specifically, we're concerned (or perhaps "interested to see how things pan out") with the following two charts and bullet point considerations.

- These are weekly bars for 10yr yields.
- Note that they're well-behaved around the 52 week moving average
- Friday marked the very first time this year that we've closed for two weeks in a row under the average.
- We STILL have resistance from the long term uptrend (teal) and the old 1.69 pivot (this is a big chart, so 1.679 - 1.71 is a valid zone)
- If we don't close below the aforementioned "zone," it's going to look incrementally gloomy, the higher above it we are.

- 104-07 is a scarey price level for Fannie 3.0s.
- It's been convincingly broken twice, EVER.
- 103-00 and thereabouts has been a good pivot point for Fannie 3.0s, with 102-00 and extremely stalwart support level.
- (not pictured) 103-24 / 103-26 would be promising near term support, but if that breaks, it looks unlikely that we'd test 104-07 again without a major shot of headline risk out of Europe.
Bottom line, the recent bull run for bond markets has been a very welcome development--not to mention that it's done wonders for rate sheets (compared to early March offerings anyway), but now it has to prove that it has legs beyond simply being a long term range bonce that coincided with bond-bullish economic data.
|
Week Of Mon, Apr 15 2013 - Fri, Apr 19 2013 |
|||||
|
Time |
Event |
Period |
Unit |
Forecast |
Prior |
|
Mon, Apr 15 |
|||||
|
08:30 |
NY Fed manufacturing |
Apr |
-- |
7.0 |
9.24 |
|
09:00 |
Net L-T flows,exswaps |
Feb |
bl |
40.0 |
25.7 |
|
10:00 |
NAHB housing market indx |
Apr |
-- |
45 |
44 |
|
Tue, Apr 16 |
|||||
|
08:30 |
CPI mm, sa |
Mar |
% |
0.0 |
0.7 |
|
08:30 |
Core CPI mm, sa |
Mar |
% |
0.2 |
0.2 |
|
08:30 |
Housing starts number mm |
Mar |
ml |
0.930 |
0.917 |
|
08:30 |
Building permits: number |
Mar |
ml |
0.940 |
0.939 |
|
09:15 |
Industrial output mm |
Mar |
% |
0.3 |
0.8 |
|
09:15 |
Capacity utilization mm |
Mar |
% |
78.4 |
78.3 |
|
Wed, Apr 17 |
|||||
|
07:00 |
Mortgage market index |
w/e |
-- |
-- |
826.1 |
|
07:00 |
Mortgage refinance index |
w/e |
-- |
-- |
4453.9 |
|
07:00 |
MBA Purchase Index |
w/e |
-- |
-- |
209.7 |
|
07:00 |
MBA 30-yr mortgage rate |
w/e |
% |
-- |
3.68 |
|
Thu, Apr 18 |
|||||
|
08:30 |
Initial Jobless Claims |
w/e |
K |
350 |
346 |
|
10:00 |
Philly Fed Business Index |
Apr |
-- |
3.0 |
2.0 |
|
13:00 |
5yr Treasury Auction |
-- |
bl |
18.0 |
-- |
|
* mm: monthly | yy: annual | qq: quarterly | "w/e" in "period" column indicates a weekly report * Q1: First Quarter | Adv: Advance Release | Pre: Preliminary Release | Fin: Final Release * (n)SA: (non) Seasonally Adjusted * PMI: "Purchasing Managers Index" |
|||||


