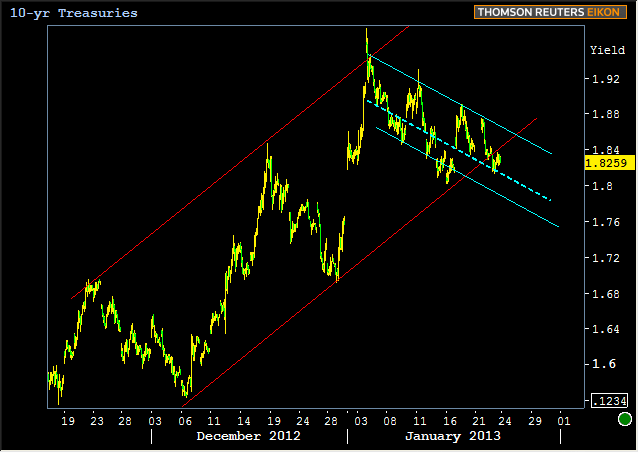
Two Thursdays in a row have offered downside surprises for Jobless Claims, resulting in downside days for bond markets. It wasn't the end of the world for MBS, but nonetheless served to keep prices contained in a pervasive, intermediate term downtrend. As far as Treasuries are concerned--which we look to for more reliable big picture guidance from a technical perspective--Thursday was uncomfortably equivocal on the topic of breaking free from a long term trend higher in yields. Here's what the chart looked like heading into the session:

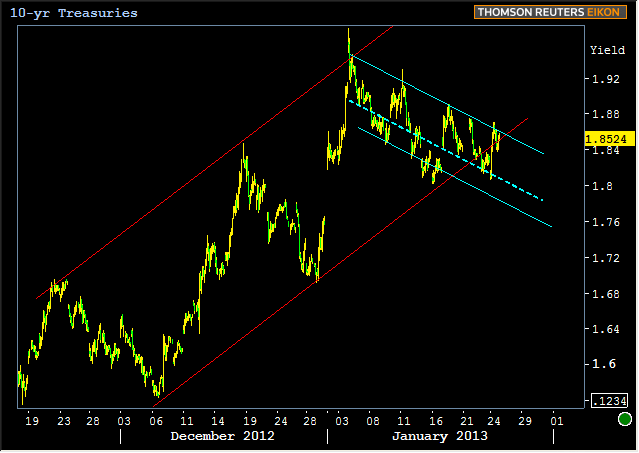
And here's how it looked at the end of the session. Note that yields finished up the day still in play for both the uptrend (red lines) and shorter term downtrend (teal).

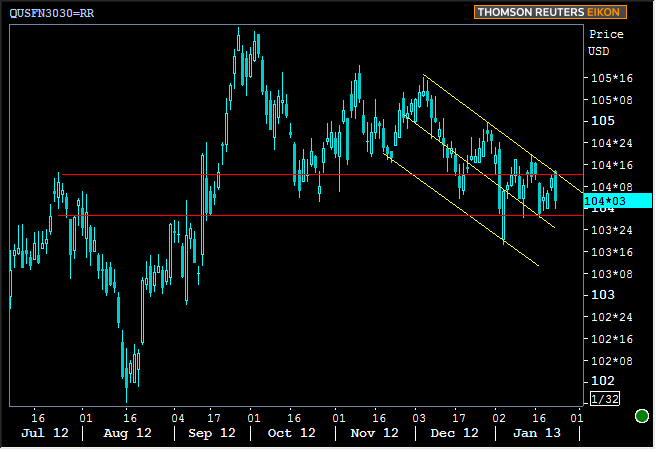
Just to be thorough, here's the same before and after for MBS. Nothing quite so equivocal here, but simply the continuation of the same old downtrend.
Before:

After:

Like last week, this Friday offers precious little by way of economic data with only New Home Sales in the 10am slot. While this may be of interest to those of us in the housing and mortgage industries, it's not characteristically a market mover. That will leave technicals, tradeflows (what's a tradeflow?), and the stock lever in play. Stocks actually had a noticeable impact on bond markets in Thursday's session, but it wasn' immediately apparent due to bond markets' early start in trading the Jobless Claims data while stocks didn't really get too excited until the exchanges opened. The stock lever has been and can continue to be fairly well connected during earnings season and in the absence of any major bond-market-specific data, so if equities start sliding, it could work to our benefit.
|
Week Of Mon, Jan 22 2012 - Fri, Jan 25 2012 |
|||||
|
Time |
Event |
Period |
Unit |
Forecast |
Prior |
|
Tue, Jan 22 |
|||||
|
10:00 |
Existing home sales |
Dec |
ml |
5.08 |
5.04 |
|
10:00 |
Exist. home sales % chg |
Dec |
% |
0.6 |
5.9 |
|
Wed, Jan 23 |
|||||
|
07:00 |
Mortgage refinance index |
w/e |
-- |
-- |
4563.7 |
|
07:00 |
Mortgage market index |
w/e |
-- |
-- |
836.5 |
|
09:00 |
Monthly Home Price mm |
Nov |
% |
-- |
0.5 |
|
Thu, Jan 24 |
|||||
|
08:30 |
Initial Jobless Claims |
w/e |
K |
355k |
335k |
|
08:58 |
Markit Manufacturing PMI |
Jan |
-- |
53.0 |
54.0 |
|
Fri, Jan 25 |
|||||
|
10:00 |
New Home Sales |
Dec |
Mln |
.385 |
.377 |
|
* mm: monthly | yy: annual | qq: quarterly | "w/e" in "period" column indicates a weekly report * Q1: First Quarter | Adv: Advance Release | Pre: Preliminary Release | Fin: Final Release * (n)SA: (non) Seasonally Adjusted * PMI: "Purchasing Managers Index" |
|||||


