Markets have been surprisingly well behaved since opening the year with an ugly little sell-off. Treasuries have been following stocks through earnings season, but taking overnight opportunities to ratchet to slightly stronger levels. In this way, Treasuries are adhering to a well-defined technical recovery, regardless of economic data. They've essentially been sneaking lower in yield overnight and tracing a lower magnitude version of stock market movements during the domestic session.
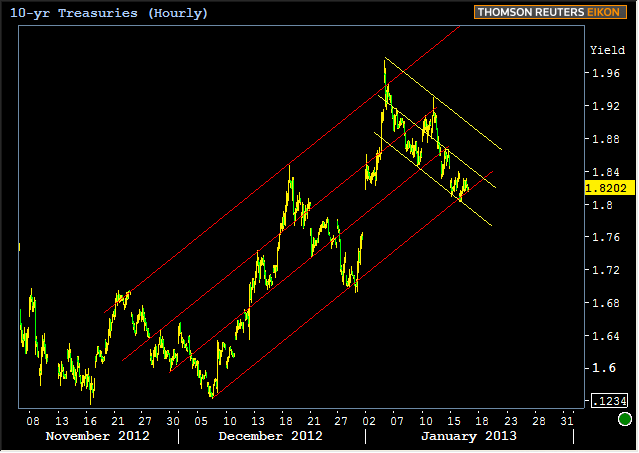
All of the above makes things at least somewhat interesting as far as charts/trends are concerned and Thursday is the most interesting day yet. It marks the collision of the short term recovery with the longer term trend toward higher yields. See both of these at work in the chart below. If the lower red line offers significant resistance, that's sort of ominous... Probably... But such ominousness would be easily undone with a nice bounce on a ceiling around 1.92.

Really, it's less to do with trying to divine whether or not rates are about to explode higher or lower, and more to do with deciding on sideline seat for sideways parade heading into the sideshow of political headlines surrounding the debt ceiling debate. Speaking of sideways, MBS has been 90% sideways at least! 90%! While that number might be completely fabricated, it's fairly close to reality.
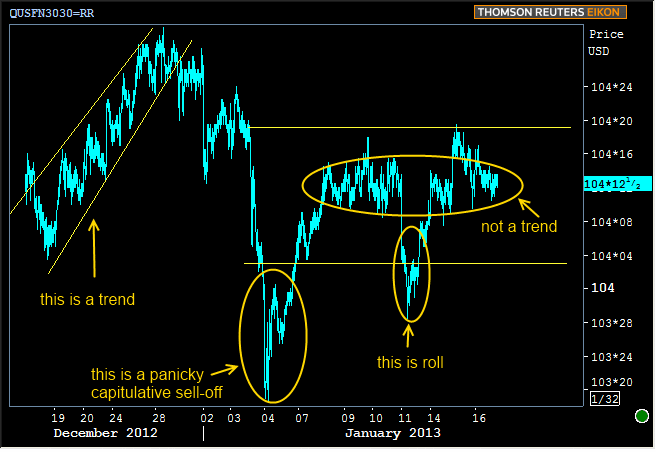
The following chart is full of cute little goodies.... Its provides a reference for what an ACTUAL TREND looks like. It establishes good modal support at 104-03 in case we sell-off again like the panicky sell-off to start the year. It offers a foil for that support with resistance at 104-19. It highlights the coupon roll (which is an abrupt, corrective time-frame for front-month MBS Price charts that you can feel free to disregard), and thus leaves the main "not a trend" oval area with the lion's share of MBS price action over the past week and a half. Either MBS are getting ready to wow us with surprising movement, or they're just mostly dead in the sense that they're not really doing anything.

There's plenty on tap today in terms of economic data:
Jobless Claims
Housing Starts
Philly Fed Index
Fed Treasury Buying
Fed-speak from Lockhart
But none of that "stuff" has had much of a bearing on bond markets in the past few days. Rather, it's just been a mild, technically regular recovery for Treasuries and a tepid sideways grind for MBS. Are we destined to remain mostly dead until the debt ceiling debate heats up? Maybe we'll get some clues that speak to that question with today's collision of trends in Treasuries. In turn, maybe MBS will witness that and come out of retirement for a week or two before we all start holding our breath for the final can-kicking verdict on the debt ceiling.
|
Week Of Mon, Jan 14 2012 - Fri, Jan 18 2012 |
|||||
|
Time |
Event |
Period |
Unit |
Forecast |
Prior |
|
Mon, Jan 14 |
|||||
|
16:30 |
Bernanke Speaks |
-- |
-- |
-- |
-- |
|
Tue, Jan 15 |
|||||
|
08:30 |
Producer prices, core mm |
Dec |
% |
0.2 |
0.1 |
|
08:30 |
Retail sales mm |
Dec |
% |
0.2 |
0.3 |
|
08:30 |
NY Fed manufacturing |
Jan |
-- |
2.00 |
-8.10 |
|
10:00 |
Business inventories mm |
Nov |
% |
0.3 |
0.4 |
|
Wed, Jan 16 |
|||||
|
07:00 |
Mortgage market index |
w/e |
-- |
-- |
726.4 |
|
07:00 |
Mortgage refinance index |
w/e |
-- |
-- |
3956.6 |
|
08:30 |
Core CPI mm, sa |
Dec |
% |
0.2 |
0.1 |
|
09:15 |
Industrial output mm |
Dec |
% |
0.2 |
1.1 |
|
09:15 |
Capacity utilization mm |
Dec |
% |
78.5 |
78.4 |
|
10:00 |
NAHB housing market indx |
Jan |
-- |
48 |
47 |
|
Thu, Jan 17 |
|||||
|
08:30 |
Jobless Claims |
w/e |
k |
365 |
371 |
|
08:30 |
Housing Starts |
Dec |
mln |
.890 |
.861 |
|
10:00 |
Philly Fed Index |
Jan |
-- |
6.0 |
4.6 |
|
Fri, Jan 18 |
|||||
|
09:55 |
Consumer Sentiment |
Jan |
-- |
75.0 |
72.9 |
|
|
|||||
|
* mm: monthly | yy: annul | qq: quarterly | "w/e" in "period" column indicates a weekly report * Q1: First Quarter | Adv: Advance Release | Pre: Preliminary Release | Fin: Final Release * (n)SA: (non) Seasonally Adjusted * PMI: "Purchasing Managers Index" |
|||||


