It's earnings season again and while bond markets are certainly taking short term cues from equities, Treasuries and MBS have willfully chosen to continue longer term trends, stepping back from multi-month lows (or highs in terms of Treasury yields) two weeks ago. This is somewhat of a paradox, considering that the Retail Sales report was stronger than expected and that stock markets generally rose all day.
But that's where the "short term cues" vs "longer term trends" thing comes into play. Day over day, bond markets closed the gap, but minute to minute, the stock lever was well-connected. Wednesday's data may offer additional chances to see if that paradoxical "connected disconnection" continues. The relevant reports are listed in the economic calendar below, but Industrial production is the only "biggie."
Apart from econ data, Goldman and JP Morgan report earnings and there's Fed-speak from Kocherlakota at 10am, just before another round of scheduled Fed QE4 buying at 10:15 (same stuff as the "Twist" buying, but not technically "Twist" now that shorter term securities aren't being sold).
--Technical Considerations--
(Warning: the following could be a bit esoteric depending on how much you want to know. Just some random musings to pass the time before things get serious--however many months into the future that might be...)
Last week, 10yr yields had a rough time making it below 1.86. But this week 10's opened in the mid 1.86's in Europe and retested the pivot point several times during the domestic session. In terms of technicals and trends, this is supportive for bond markets and that fact was born out in Tuesday's session.
Referring to MBS trading as "supportive" is a bit of stretch considering the supply-driven sell-off in the afternoon, but two counterpoints come to mind. First, getting through origination supply, in itself, is fundamentally supportive of future prices (supply down, demand up?). Second, Fannie 3.0s ended essentially in line with Monday's close. In terms of day-over-day charts, this will look like a side-step at recent highs.
It was unpleasant in the narrow scope of Tuesday afternoon, but in the bigger picture, we're more interested to see if bond markets, as a whole, are serious about pivoting powerfully from the inflection point represented by 1.86-ish in 10yr yields, or if this has been repeat of the previous friendly correction in late December, destined to bounce us back into recently weaker levels. There are many ways to look at this, and the smartest are probably those that call for relative containment between the low 1.9's and mid to high 1.7's ahead of the debt ceiling debate, but here are two that sort of jump off the page, each represented in the following chart (explanation follows)
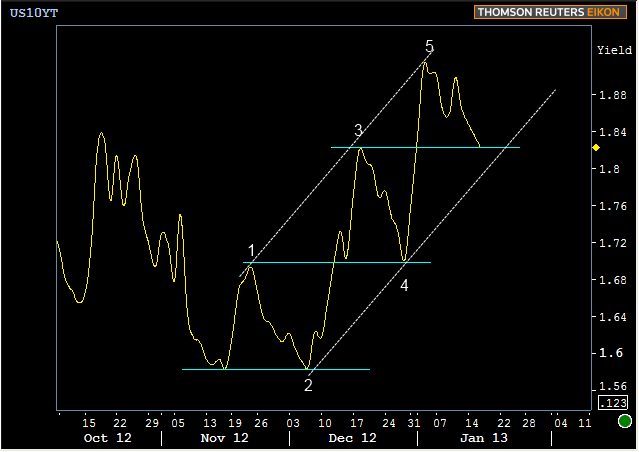
Any time you see that see-saw pattern with the numbers 1-5 on the chart, chances are good that someone is making a case for an Elliot Wave pattern. I'm not sure that's what we're dealing with here and E-Wave theory is inherently open to criticism, but it's one way to look at the market, and could be sort of "fun" in a sick way. The gist is that a trend began in mid Nov, with the first wave ending shortly thereafter (1). Wave 2 brought yields back down but obeyed the first E-Wave rule in that it didn't move lower than the starting point of wave 1. The third wave brought yields to higher highs into late December, obeying the 2nd E-Wave rule which says wave 3 can't be shorter than 1 or 5. The final rule is that the 4th wave can't cross into territory from the first wave. It does not, and so we technically have an E-Wave pattern. There's no hard and fast rule as to where yields are supposed to go from here, but in general, it suggests that early January marked high yields.
The very same chart has two conveniently placed dotted lines that conveniently fall along the highs and lows and are conveniently perfectly parallel....conveniently. This is simple "TRENDING," and is the sort of "railroad track" formation that has prompted us to say such things in the past as "the trend is your friend, until it's not your friend anymore" (not taking credit for that, for the record, but don't know who first said it). This one's way more simple, and doesn't suggest much. Rather, it's more of an observation that "this is how markets are trending, and we'll know that they're done with that trend when they break outside the parallel lines." This way of looking at things would allow for further improvements on Wednesday without violating the longer term bearish trend. Getting a break below the lower line for two days in a row would go a long way toward confirming that we're bouncing back.
|
Week Of Mon, Jan 14 2012 - Fri, Jan 18 2012 |
|||||
|
Time |
Event |
Period |
Unit |
Forecast |
Prior |
|
Mon, Jan 14 |
|||||
|
16:30 |
Bernanke Speaks |
-- |
-- |
-- |
-- |
|
Tue, Jan 15 |
|||||
|
08:30 |
Producer prices, core mm |
Dec |
% |
0.2 |
0.1 |
|
08:30 |
Retail sales mm |
Dec |
% |
0.2 |
0.3 |
|
08:30 |
NY Fed manufacturing |
Jan |
-- |
2.00 |
-8.10 |
|
10:00 |
Business inventories mm |
Nov |
% |
0.3 |
0.4 |
|
Wed, Jan 16 |
|||||
|
07:00 |
Mortgage market index |
w/e |
-- |
-- |
726.4 |
|
07:00 |
Mortgage refinance index |
w/e |
-- |
-- |
3956.6 |
|
08:30 |
Core CPI mm, sa |
Dec |
% |
0.2 |
0.1 |
|
09:15 |
Industrial output mm |
Dec |
% |
0.2 |
1.1 |
|
09:15 |
Capacity utilization mm |
Dec |
% |
78.5 |
78.4 |
|
10:00 |
NAHB housing market indx |
Jan |
-- |
48 |
47 |
|
Thu, Jan 17 |
|||||
|
08:30 |
Jobless Claims |
w/e |
k |
365 |
371 |
|
08:30 |
Housing Starts |
Dec |
mln |
.890 |
.861 |
|
10:00 |
Philly Fed Index |
Jan |
-- |
6.0 |
4.6 |
|
Fri, Jan 18 |
|||||
|
09:55 |
Consumer Sentiment |
Jan |
-- |
75.0 |
72.9 |
|
|
|||||
|
* mm: monthly | yy: annul | qq: quarterly | "w/e" in "period" column indicates a weekly report * Q1: First Quarter | Adv: Advance Release | Pre: Preliminary Release | Fin: Final Release * (n)SA: (non) Seasonally Adjusted * PMI: "Purchasing Managers Index" |
|||||


