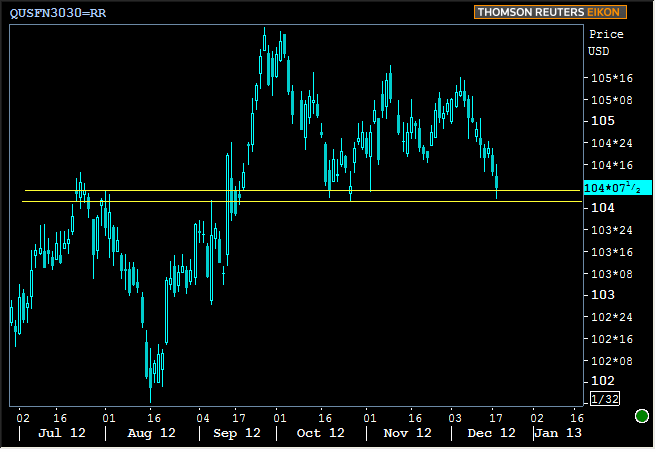
With the help of QE3, MBS have been able to construct an impressive, even if metaphorical castle over the past four months. This can be thought of as simply as a Fannie Mae 30yr Fixed 3.0 coupon MBS price level somewhere in the low 104's. Since mid September, a general lack of sincere motivation has kept bond markets contained in one of their typical "sideways grinds" most easily characterized by a 30bp range in 10yr Treasury yields. What had been 1.85-2.15 is now 1.55-1.85 and has been for the duration of MBS's "castle days." This sideways grind has enabled MBS to triumphantly defend levels that were previously barely touched. What once was "super high," now became "scary low."
But this most recent attitudinal shift regarding the Fiscal Cliff has quickly woken bond markets up to the reality that their unprecedented combination of high prices and low volatility isn't immune from shocks. In fact, perhaps the uncertainty leading up to Fiscal Cliff deadlines could have been the very thing keeping prices high and stable, as opposed to recently less uncertain suggestions from the headlines somehow damaging "something that was already intact."
To be clear, all-time high MBS prices are perfectly justified following QE3, but even if we don't think about the past two months of super stable, super low rates "unjustified," we at least have to wonder how much of that stability was due to broader economic uncertainty. Indeed, that's been central to much of our analysis recently, and so it makes sense to see the stability come under threat as the perception of certainty is increased. It makes sense to see an enemy at the gate--returning to the castle walls just over 104-00.

In the days ahead, it's these technical levels that will most readily serve as milestones for how the mortgage market is digesting the Fiscal Cliff news. Further, meaningful losses below 104 would essentially be the end of an era. That's not to say that one brief slip below the yellow lines, and we're toast (just as the few blips into the 104's in July didn't see rampant follow-through to higher prices), but all things being equal, a confirmed break below 104 would be a sobering suggestion that the post QE3 trend is breaking.
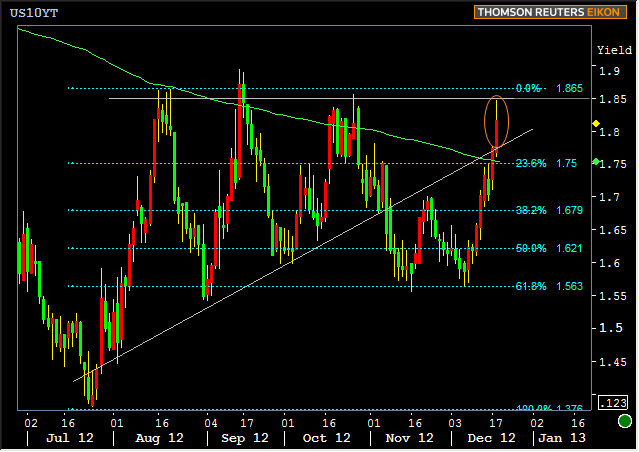
Even without regard to QE3 and MBS-specific considerations, there's cause for concern in looking at broader bond markets. Here's how 10yr yields have experienced the same time frame:

Tuesday's recap said: "it's worth noting that the last 3 times 10's have broken over the 1.75 technical level, they haven't moved back below 1.75 without first hitting 1.85." Well... That didn't take long, unfortunately. With Tuesday's move, 10's did all sorts of technically ominous stuff surrounding that 1.75 level, the 200 day moving average (green line), and the uptrend that had governed August through October. Three different ways to look at the big picture with three different lines... All were ceilings Tuesday morning and all are floors at the moment.
It's tempting to be excited about the 1.85-ish ceiling coming into play, but it should probably be more scary than exciting considering that we don't even have a Fiscal Cliff deal yet! If 10's move to test the 1.85 ceiling on the the simple fact that Republicans and Democrats seem to be playing more nicely together this week, then what's the implication for when a deal is actually inked? Barring a paradoxical deflation of risk where stocks sell and bonds rally on a Fiscal Cliff resolution, recent trading suggests yields could go higher into the end of the year even if politicians merely LOOK like they're close to a deal.
The saving grace would be a major technical correction that happens RIGHT NOW, as in Wednesday or Thursday. In fact, even if yields can simply hold sideways, as long as they bounce back lower BEFORE a Cliff deal is imminent, it leaves room for current weakness to be construed as a "surprise inspection of the range." This, in itself, would leave room for that recently explored range boundary to have a shot at being a supportive ceiling against any post-Cliff-deal sell-offs.
Frustratingly, we're generally at the mercy of headlines again as the data is thin, with only Housing Starts for morning data. The 7yr Auction at 1pm may play a supporting role in understanding the day's market movements in that a decent auction could provide a measure of relief as the final Treasury Note auction of the year. Even then, the right mix of Cliff headlines rules all.
|
Week Of Mon, Dec 17 2012 - Fri, Dec 21 2012 |
|||||
|
Time |
Event |
Period |
Unit |
Forecast |
Prior |
|
Mon, Dec 17 |
|||||
|
08:30 |
NY Fed manufacturing |
Dec |
-- |
-1.00 |
-5.22 |
|
09:00 |
Treasury International Capital |
Oct |
bl |
-- |
-- |
|
13:00 |
2-Yr Note Auction |
-- |
bl |
35.0 |
-- |
|
Tue, Dec 18 |
|||||
|
08:30 |
Current account |
Q3 |
bl |
-103.5 |
-117.4 |
|
10:00 |
NAHB housing market indx |
Dec |
-- |
46 |
46 |
|
13:00 |
5-Yr Treasury Auction |
-- |
bl |
35.0 |
-- |
|
Wed, Dec 19 |
|||||
|
07:00 |
Mortgage market index |
w/e |
-- |
-- |
931.2 |
|
08:30 |
Housing starts |
Nov |
ml |
0.875 |
0.894 |
|
13:00 |
7-Yr Note Auction |
-- |
bl |
29.0 |
-- |
|
Thu, Dec 20 |
|||||
|
08:30 |
Initial Jobless Claims |
w/e |
k |
355 |
343 |
|
08:30 |
GDP |
Q3 |
pct |
+2.8 |
+2.7 |
|
10:00 |
Existing Home Sales |
Nov |
Ml |
4.85 |
4.79 |
|
10:00 |
FHFA Home Prices |
Oct |
% |
-- |
+0.2 |
|
10:00 |
Philly Fed Index |
Dec |
% |
-2.5 |
+10.7 |
|
13:00 |
5-Yr TIPS |
-- |
bl |
14.0 |
-- |
|
Fri, Dec 21 |
|||||
|
08:30 |
Durable goods |
Nov |
% |
0.5 |
0.5 |
|
08:30 |
Personal Incomes/Outlays |
Nov |
% |
.3/.4 |
0.0/-0.2 |
|
09:55 |
Consumer Sentiment |
Dec |
-- |
74.5 |
74.5 |
|
* mm: monthly | yy: annual | qq: quarterly | "w/e" in "period" column indicates a weekly report * Q1: First Quarter | Adv: Advance Release | Pre: Preliminary Release | Fin: Final Release * (n)SA: (non) Seasonally Adjusted * PMI: "Purchasing Managers Index" |
|||||


