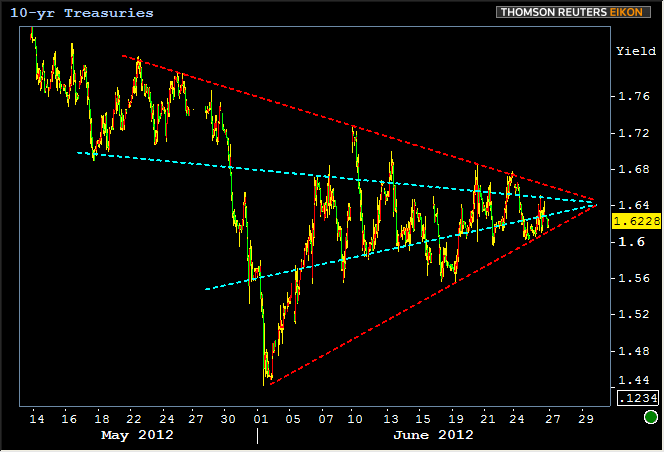
Bond markets moved modestly weaker yesterday, helped along mostly by a technical 'unwillingness' for benchmark 10yr Treasuries to venture under 1.60 on Monday. That's right. Tuesday's movement was caused by Monday's trading--at least in a general sense.
The implication/suggestion is that markets aren't quite sure what to do with themselves at the moment and have taken on a sort of "scared, fickle lemming" stance where every factor of moderate importance gets a courtesy nod from trading levels but not too much follow through, especially not if such a move would carry them through established technical boundaries. Said boundaries are one of any numbers of converging trends seen below.

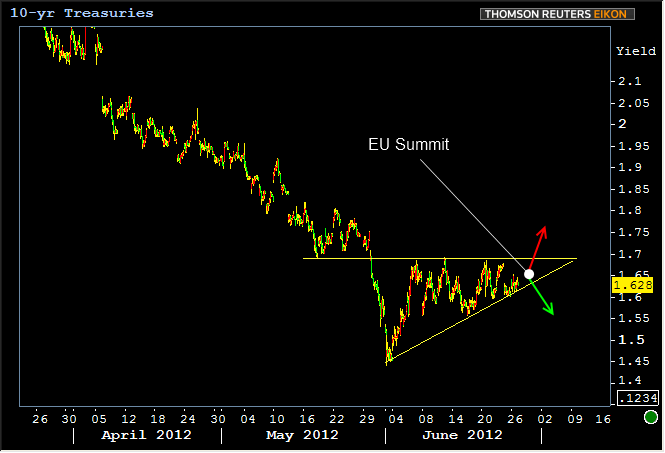
The TEAL lines are sort of like the "central tendency" of the broader consolidation. So Monday morning's trading action went a long way toward reinforcing the lower RED resistance line, thus more bouncing yesterday, at least from a technical perspective. Even if you don't want to completely accept the technical reading above, at the very least, markets are clearly consolidating. The chart below gives a hint as to the determining factor for this consolidation might be (Note, this chart only includes higher volume domestic trading hours because we see th horizontal pivot point just under 1.70 as a more domestic consideration, even if only psychologically):

In other words, markets pivoted below the previous all time lows just under 1.7 and have held that pivot point as a supportive ceiling ever since. You may remember throughout June that we looked forward to Greek elections on the 17th and FOMC on the 20th, and either of those events had the potential to break the range (and in fact DID during European trading hours following the Greek election), but ultimately, the range stayed contained during domestic hours. At this point the last majorly informative event that might inform a breakout would be the EU Summit taking place the last two days of this week.
That makes today sort of an odd duck in the sense that it's SUPPOSED to stay contained between these consolidating trends. It might not though (markets can be ill-behaved sometimes). But assuming it does stay mostly contained, this would further add to the tension mounting over the EU Summit trade (and a fair amount of domestic economic data as well).
The economic events helping to flesh out the picture today include the 5yr Treasury auction at 1pm and Durable Goods in the morning. We don't really see either of these as major market moving considerations, as previously noted, and think markets are concerned with the bigger picture at this point. NOTE: "being concerned with the bigger picture" doesn't necessarily mean "a big breakout," but it does mean that we're not expecting today's events to cause major deviations from this range trade. Any such events would have to be "front-running headlines" that speak to Thursday and Friday's EU Summit or some other equally juicy unexpected headline surprise.
|
Week Of Mon, Jun 25 2012 - Fri, Jun 29 2012 |
||||||
|
Time |
Event |
Period |
Unit |
Forecast |
Prior |
Actual |
|
Mon, Jun 25 |
||||||
|
10:00 |
New home sales-units mm |
May |
ml |
0.346 |
0.343 |
.369 |
|
10:00 |
New home sales chg mm |
May |
% |
-- |
3.3 |
+7.6 |
|
Tue, Jun 26 |
||||||
|
09:00 |
CaseShiller 20 mm nsa |
Apr |
% |
0.1 |
0.0 |
+1.3 |
|
09:00 |
CaseShiller 20 mm SA |
Apr |
% |
0.4 |
0.1 |
+0.7 |
|
09:00 |
CaseShiller 20 yy |
Apr |
% |
-2.5 |
-2.6 |
-1.9 |
|
10:00 |
Consumer confidence |
Jun |
-- |
63.8 |
64.9 |
62.0 |
|
13:00 |
2-Yr Note Auction |
-- |
bl |
35.0 |
-- |
-- |
|
Wed, Jun 27 |
||||||
|
07:00 |
Mortgage market index |
w/e |
-- |
-- |
941.5 |
-- |
|
07:00 |
Mortgage refinance index |
w/e |
-- |
-- |
5385.8 |
-- |
|
08:30 |
Durable goods |
May |
% |
0.5 |
0.0 |
-- |
|
10:00 |
Pending homes index |
May |
-- |
-- |
95.5 |
-- |
|
10:00 |
Pending sales change mm |
May |
% |
1.0 |
-5.5 |
-- |
|
13:00 |
5-Yr Treasury Auction |
-- |
bl |
35.0 |
-- |
-- |
|
Thu, Jun 28 |
||||||
|
08:30 |
Initial Jobless Claims |
w/e |
k |
385 |
387 |
-- |
|
08:30 |
Q1 Final GDP |
Q1 |
% |
+1.9 |
+1.9 |
-- |
|
08:30 |
GDP Deflator |
Q1 |
% |
+1.7 |
+1.7 |
-- |
|
13:00 |
7-Yr Note Auction |
-- |
bl |
29.0 |
-- |
-- |
|
Fri, Jun 29 |
||||||
|
08:30 |
Personal consump real mm |
May |
% |
0.0 |
0.3 |
-- |
|
08:30 |
Personal income mm |
May |
% |
0.2 |
0.2 |
-- |
|
08:30 |
Consumption, adjusted mm |
May |
% |
0.1 |
0.3 |
-- |
|
08:30 |
Core PCE price index mm |
May |
% |
0.2 |
0.1 |
-- |
|
09:45 |
Chicago PMI |
Jun |
-- |
52.9 |
52.7 |
-- |
|
09:55 |
Consumer sentiment |
Jun |
-- |
74.1 |
74.1 |
-- |
|
09:55 |
Consumer conditions |
Jun |
-- |
81.5 |
82.1 |
-- |
|
09:55 |
Consumer expectations |
Jun |
-- |
68.3 |
68.9 |
-- |
|
* mm: monthly | yy: annual | qq: quarterly | "w/e" in "period" column indicates a weekly report * Q1: First Quarter | Adv: Advance Release | Pre: Preliminary Release | Fin: Final Release * (n)SA: (non) Seasonally Adjusted * PMI: "Purchasing Managers Index" |
||||||


