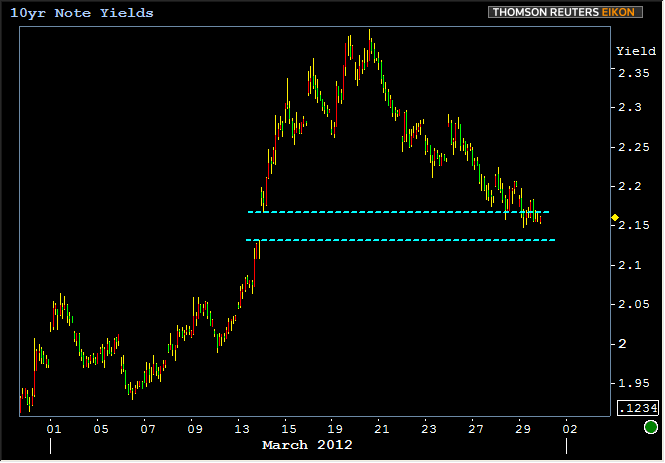
For bond markets, yesterday was essentially a reassertion of Wednesday's strongest levels. Well, maybe it was also a failed attempt to confirm a break through to stronger levels. Maybe it was both? Take a look at the chart that follows and decide for yourself. Please note, we are focusing on 10yr yields intentionally due to their greater technical merits over MBS despite the latter being the namesake of our commentary.
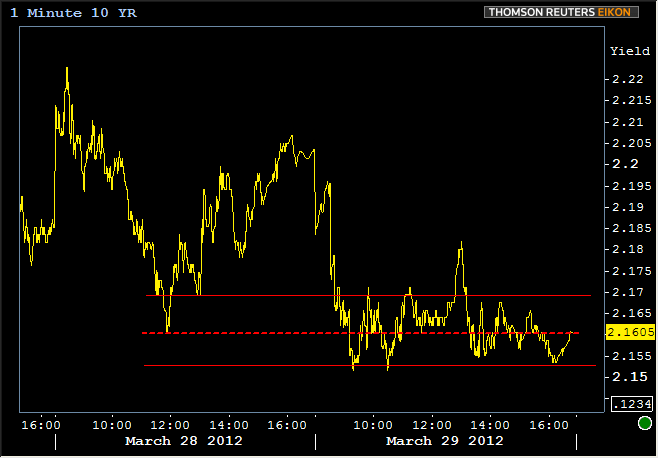
So there you have it! Or do you? (Or do we?)... We'll admit that it would be equally hard to argue against viewing this movement as a break and confirmation below 2.17 or as a resistance floor at 2.153. Then there's the mid-point just over 2.16 which has some credence as a retracement level between 2.10 and 2.40. Maybe we shouldn't read any bias into trading here and simply view Thursday as a grind AROUND that retracement level (the dotted line) that is yet to be decided.
For the bulls, there's the fact that we've not yet exhausted our exploration of "the range." For what it's worth, this would be the "new range"--the one whose lower yields share a boundary with the higher yields from the previous range (2.1-1.8). In that sense, there's 2.10 to target for at least a test before we resign ourselves to a bearish correction inside the new range. Even the other popular technical level at the moment, 2.13-ish, would allow for a bit more upside from current levels.
For the bears, apart from the sense of hitting a floor today, there's the nearness of that floor to the just-mentioned 2.13 technical level. This can be seen in the lower dotted line in the chart below. Yields gapped from there at the close on 3/13 higher to 2.17 at the open on 3/14.
Rather than trying to force definitions of technical patterns onto that chart, I'll just say that the shapes and trading levels in the chart above are reminiscent of a candlestick formation known as an "upside tasuki gap." In fact, if we wanted to be particular about it, we could combine adjacent candles to form big 6-day candles that would end up looking something like this semi-official representation of the Upside Tasuki Gap formation (Investopedia will tell you more if you don't believe us):
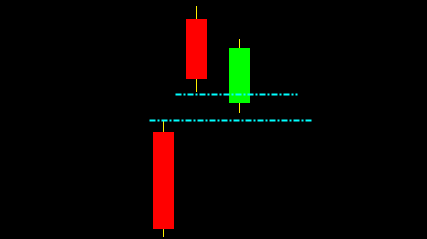
Whether bond bears would prefer to place their fair in the candle formations or simply observe that 10's didn't show convincing follow-through on the recent corrective rally, they can all rely on the notion argument that things seemed to "fizzle out" a bit yesterday.
Either we really are looking at a fizzling out, or 10's merely "aren't quite there yet." Here's the big secret: it could still go either way, and whether or not we see a test of the "new range" (be it 2.13+ or 2.10) will probably depend on this morning's data (barring an overnight headline or event of uber significance). 'Incomes and Outlays' is a significant report with a significant implication on Q1 GDP. Whereas yesterday's GDP numbers looked backward to Q4, today's speak to the current quarter's output, and traders are cognizant of the fact that strong results will push up Q1 GDP forecasts. Chicago PMI and Consumer Sentiment flesh out the economic data if Incomes and Outlays isn't enough to send markets in one direction or another.
Here's the run-down:
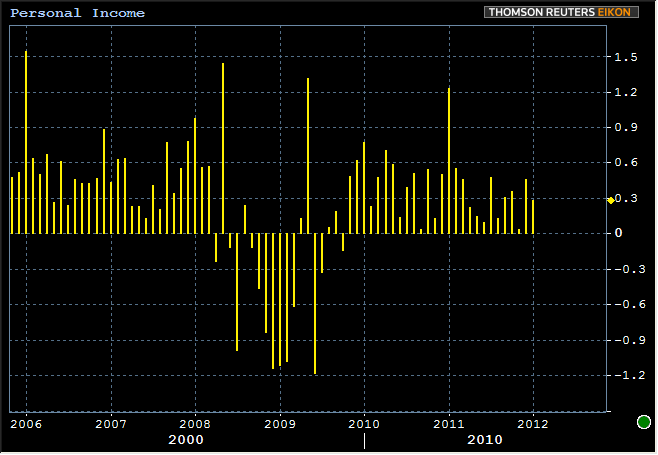
0830 AM - PERSONAL INCOME
Forecast: +0.4 vs. Previous: +0.3
- PERSONAL CONSUMPTION ( +0.6 vs +0.2)
- CORE PCE PRICE INDEX (+0.1 vs +0.2)
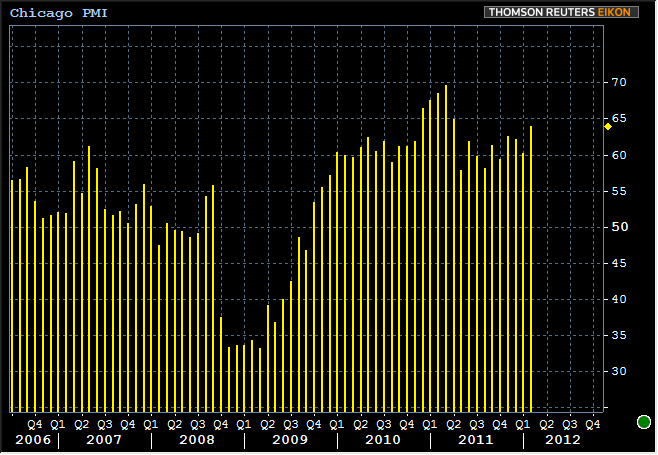
0945 AM - CHICAGO PMI
Forecast: 63.0 vs. Previous: 64.0
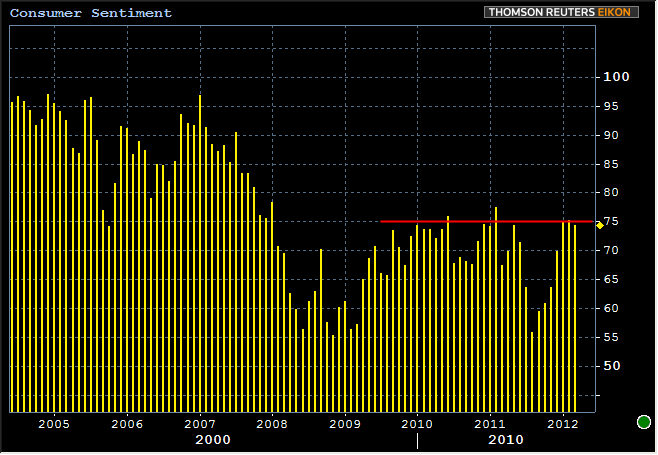
0955 AM - CONSUMER SENTIMENT
Forecast: 74.6 vs. Previous: 74.3