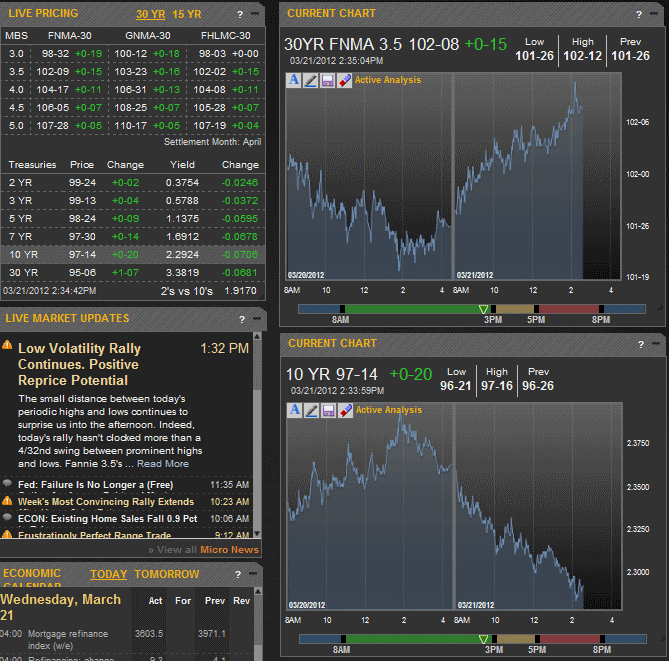
Even if the "need" being satisfied were purely psychological, today's rally is a welcome sight. Unlike instances of positive price action in the recent past, today's rally has been stable and directional, with small deviations from a central trend higher in price. MBS began the day operating near the old "concrete ceiling/floor" levels that we made so much fuss about in late 2011 and marched convincingly higher to the 102-10 pivot (Fannie 3.5's).
(source: MBS Live)
There are a few aspects to today's rally that make it seem promising and a few that suggest that we still shouldn't let our guard down. As is always, ALWAYS the case, we first must observe a trend being broken before we can know how long it will last. On the "let's not get too carried away" side, we're still missing a big break below the big pivot point in 10's that saw big volume during last week's big sell-off.
This next chart is a bit of a busy chart, so let's talk it out. First of all, we're looking at 10yr yields with more interest than MBS when the market is making big moves outside recent ranges. Bond markets are not benchmarking major shifts based on MBS prices, plain and simple.
So here's what I noticed about the following chart:
- yields had been trending higher since the initial breakout on 3/14
- that trend channel (teal lines) was tested and broken this morning.
- yields returned to bounce on the other side as well, helping confirm the break
- this can also be viewed as a test and break of 2.33 which has seen high volume bounces recently
- today's rally stopped at 2.29, probably the "biggest deal" in terms of pivot points that could act as milestones for a rally
- 2.29 should be though of in conjunction with 2.26 as an entire zone of resistance/support
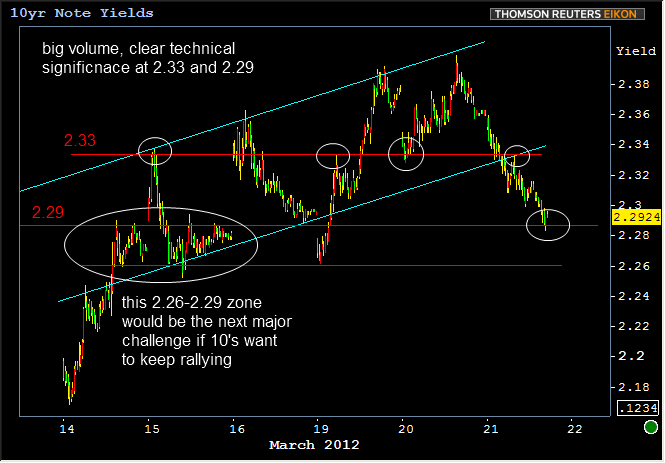
In other words, there were some positive technical developments with today's rally. Volume wasn't epic, but it was healthy. Breaking below 2.33 was a good thing was far as technicals are concerns, but 2.29 is big deal. Personally, I'd feel more comfortable about a break through 2.29 that also broke 2.26 or even 2.25. If we don't get that "point after attempt," any initial break of 2.29 is susceptible to bouncing right back over. See the morning of 3/19 as an example
For those of you with a keen enough mind's eye, imagine you could fill in the space between 2.26 and 2.29 with a thick red marker... In that sense, we've only broken through that line 1 time since October 2011, hence the "entire zone" approach.
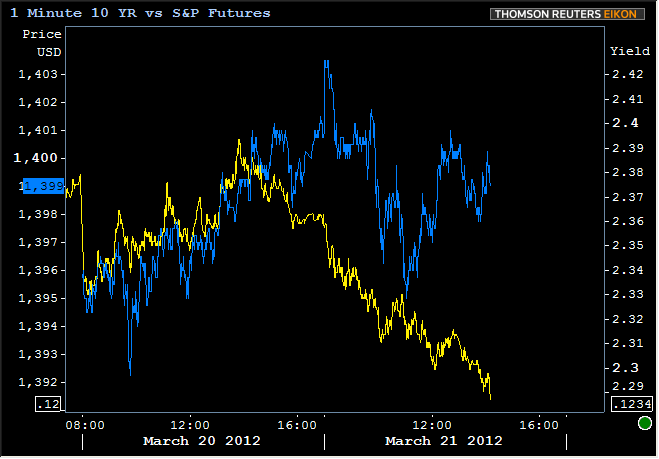
One other positive aspect of today's rally was the sense that Treasuries were marching to the beat of their own drummer as opposed to taking cues from stocks today. We've noted more stock lever connection in recent days and weeks, but not much at all today.