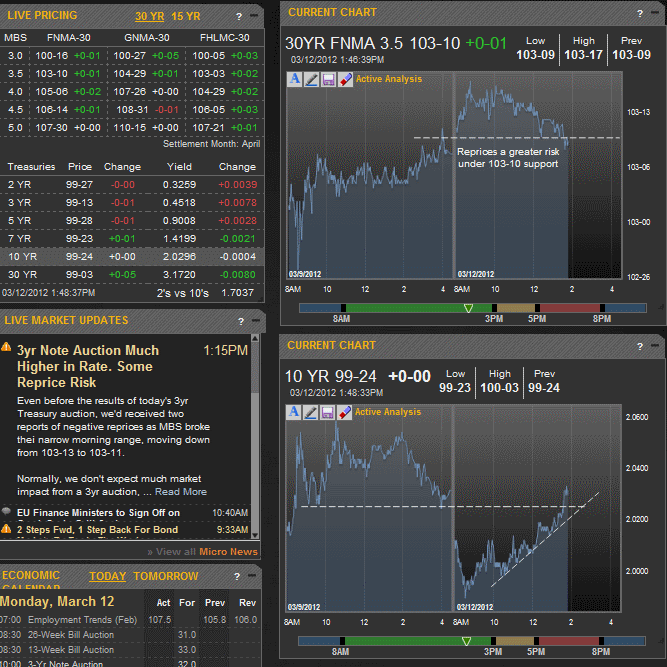
As expected, volume and volatility have been quite light today as the week's more meaningful events are on hold until tomorrow. This morning's scheduled Fed buying in the 30yr sector as well as this afternoon's 3yr Treasury Auction haven't had much of an impact on prices, with traders attributing more movement to flows and positioning for the rest of the week. Indeed, the trading range in MBS has been less than 6/32nds, but that has been almost exclusively down since just after 10am.
Last Thursday was "the roll" for Fannie and Freddie 30yr fixed MBS. March coupons were retired and we move to viewing April coupons as the "front month," aka the first MBS coupons in line to be delivered/settled. Just like lenders tend to pay less rebate for longer lock periods, MBS coupons that are farther out in delivery time (always one month increments into the future) tend to be lower in price.
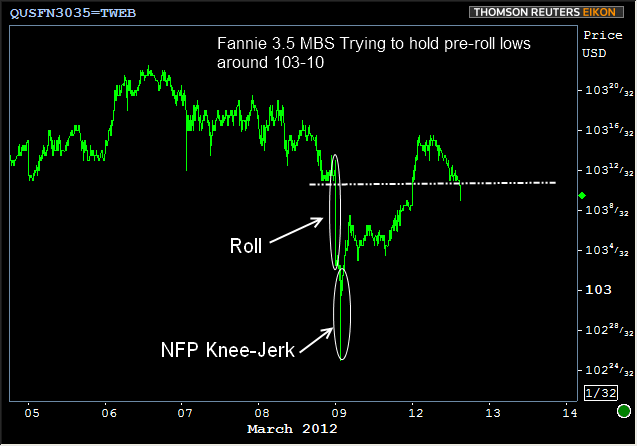
So switching from viewing March to viewing April makes for an abrupt shift in the current MBS chart which is always going to be tracking the front month. As you can see in the chart below, the last little bit of technical price action in March's 3.5's showed some support at 103-10. This level had been in play as a pivot point before last week as well. And that's where MBS have been grinding around this afternoon, albeit in light volume.

From a technical standpoint, the 103-10 level in MBS would be nice to hold, but it wouldn't be the end of the world if we broke below. The more pertinent technical levels are actually in benchmark 10yr Treasuries. (I know this sounds odd to be viewing 10's as MORE pertinent than MBS on an MBS site! But it's solely for the purpose of assessing broad shifts based on technical analysis. 10's are simply superior in that regard).
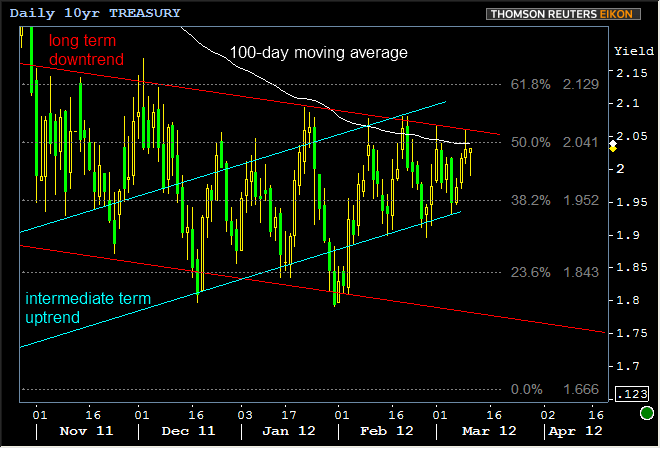
10's are still in the process of deciding what they want to do with their lives now that they've spent an unprecedented amount of time near and under 2%. If you focus just on the red lines below (which I adjusted today to a gentler slope to accommodate the recently less aggressive yields), we see a series of "lower highs" all the way back to November, but being increasingly "tested" in February and March. That trend is also close to the 100-day moving average, which isn't a surefire guarantee of a sell-off if broken, but just one more thing to consider if we see bullish trends breaking.

The first implication of a broken downtrend (10's rising outside the red lines), is to assess a "sideways" trend where 10's would prod previous horizontally important yield levels as high as 2.13, which is a pivot point and the 62% retracement level of the entire range since August 2011 FOMC. Sideways ranges have a chance to get established under 2.10 as well with recent highs ranging from 2.06-2.09. If horizontal support levels start getting broken successively, the predominant uptrend could line up with the teal lines. That potentiality is premature for today's discussion, and indeed the ability of 10's to stay range bound continues to surprise. We wouldn't make any plans for a breakout until we're witnessing one.


