Latest Alert From MBS Live:
Treasuries, MBS Attempting to Turn a Corner Following 30yr Auction - 2:06PM
Volume
surged briefly following the 1pm 30yr Bond Auction, but has since died
down. In the process, Treasury yields and MBS prices experienced a bit
of volatility, but that now seems to be resolving itself in a favorable
manner. Fannie 3.5 MBS are down only 4 ticks on the day at 103-23, and
10yr yields are down to 2.045 after being as high as the 2.07's before
the auction.
New and meaningful headlines out of Europe have
slowed to a trickle and there are no other major decisions or
announcements scheduled to be made today. Several officials are on
record as saying that the Greek bailout agreement is a done deal but
other officials note that nothing official will be announced today.
Whether
it's some hesitation on that news or simple technical exhaustion after
selling off nearly 30 bps in February, 10yr yields look as if they'll
record a closing mark under or very close to long term support for their
trend channel which passes through 2.56 today.
MBS charts are
starting to look fairly decent considering the morning weakness, with a
nice double bounce off 103-18. If prices were to continue to operate at
current levels, a few lenders might soon consider a positive reprice,
but the morning volatility means there could be more hesitation than
normal. We also tend to see fewer reprices during the MBS settlement
cycle, and today is "48 hour day" and March coupons will be front-month
after the close tonight.
The long term charts are exceedingly interest after today's price movements. Let's take a look at long term Fannie 3.5 30yr MBS. Granted, prices on this chart are about to "drop" as March coupons take the reigns from the February coupons that will no longer be traded after today, and currently, that will drop prices to 103-08, well below either the horizontal line seen in the chart, but still well within the long term trend channel. Implications for the future? None really, but this is the trend channel that we're in until we confirm a break lower or higher.

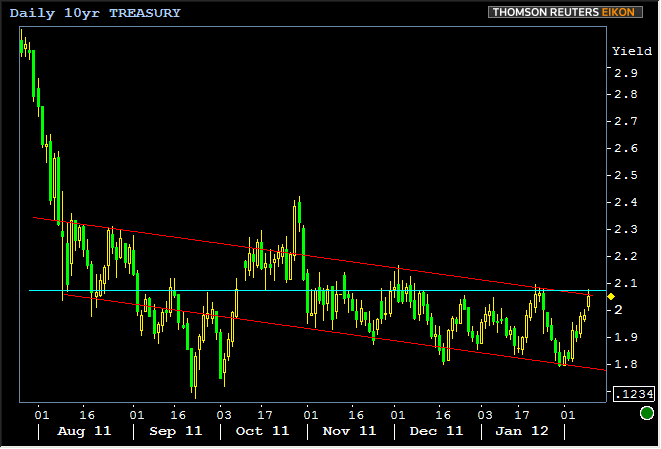
In Treasuries, we can now go back all the way to August in looking at a long term trend. This is one that we've posted a few times over the past few months, but things haven't ever lined up very well until today. Reason being: the prominent highs from late January, early December, all the lead up to the EU summit in mid-October (spike higher = failed breakout attempt), as well as numerous highs in August when the rally first got underway, all line up with the upper red line fairly well. And the lower red line is no slouch. The teal line we throw in as the horizontal pivot point that has been one of the best dividing lines between highs and lows throughout the really. When yields have been above or below, they've tended to stay there. If they stay below again this time, it should prove to be positive for MBS.